Introducing the Screen Components
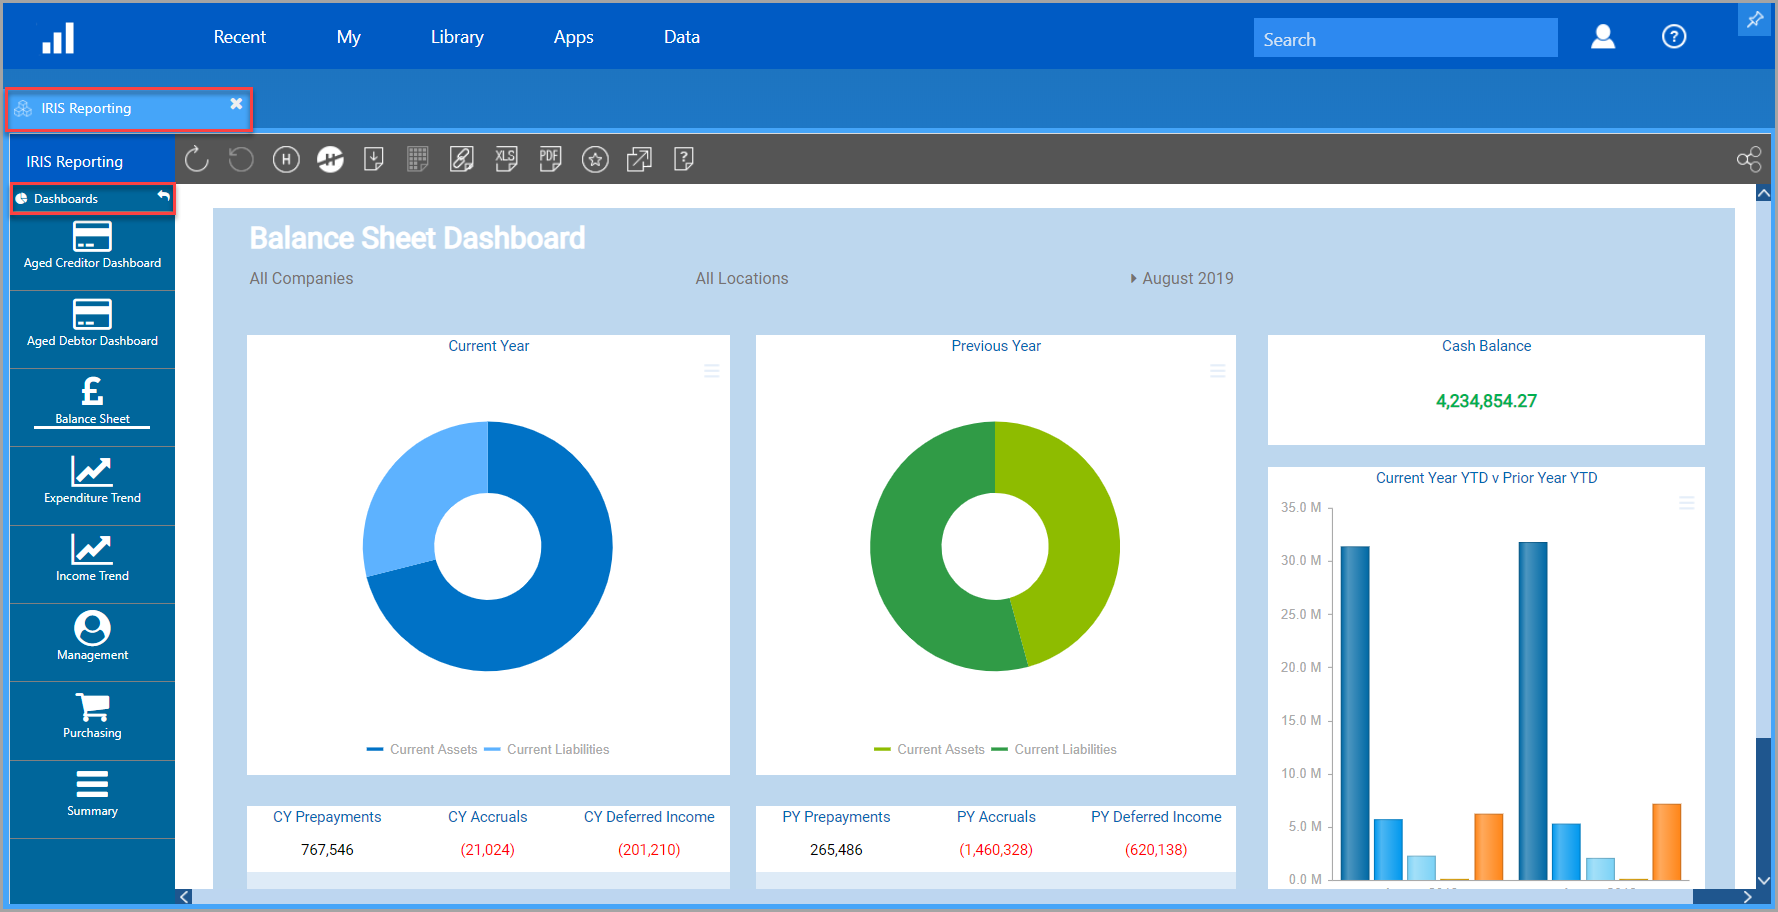
After logging in, the main screen is displayed which will appear similar to the following graphic (the content is determined by the person managing your system).
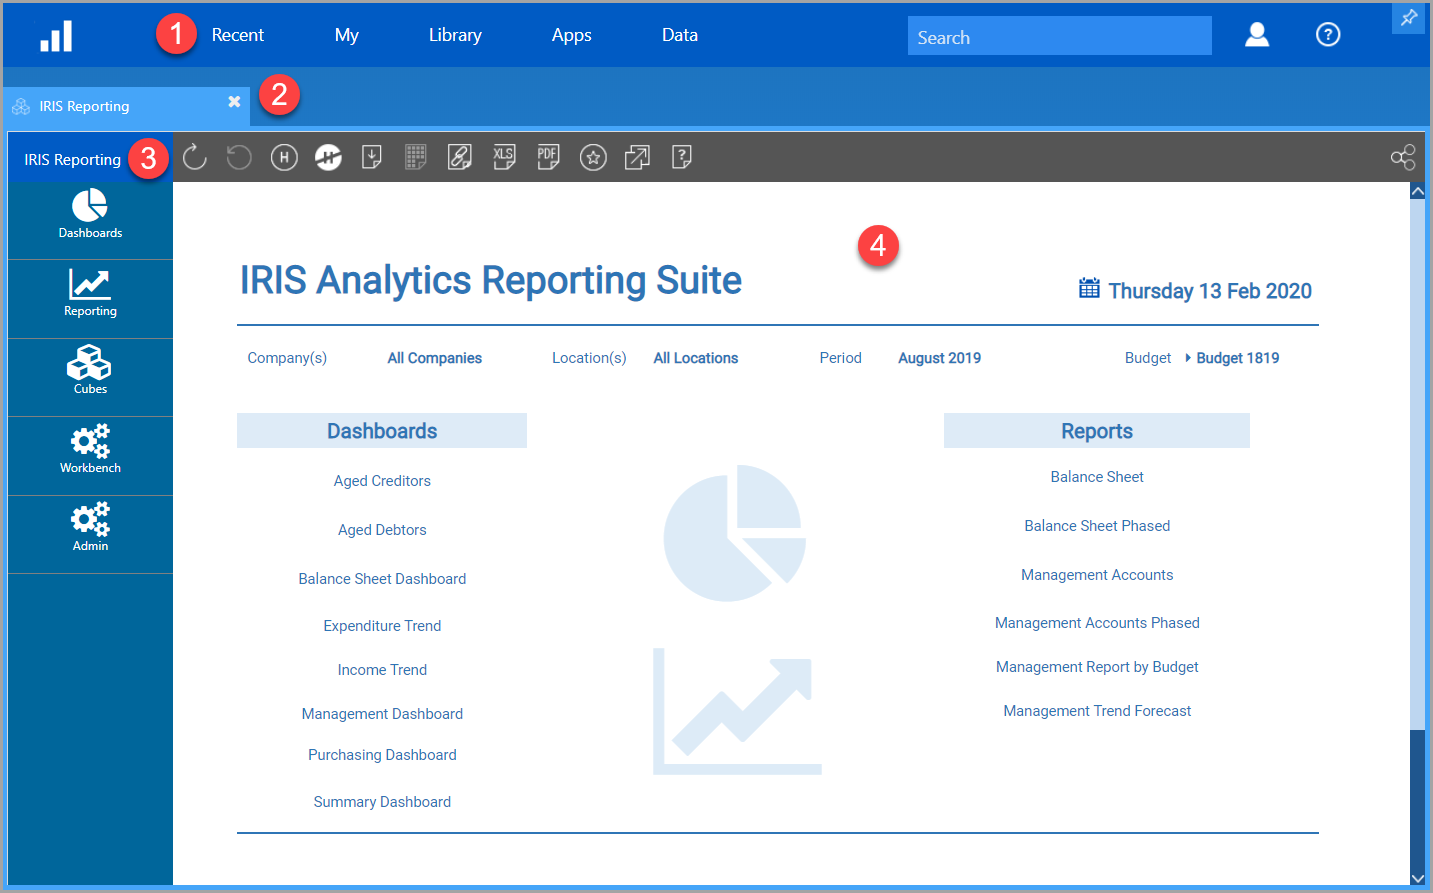
The following table lists the key components of the screen with more detailed explanations below. Click on the component name for more information.

|
Header - The header appears at the top of the application and is used to access the key functions within the software. |

|
Tab Panel - IRIS Analytics provides a multi-window environment. Tabs function in a similar way to internet browser tabs enabling you to switch between windows/functions. |

|
App Panel - This panel is displayed when an app panel is selected via the Apps drawer on the application header and provides access to the various dashboards, data views and reports available. |

|
Working Area - The content of the working area part of your screen will vary from reports, data views and dashboards depending on what options are selected from the Apps or Data panel. |
1. Header/Toolbar
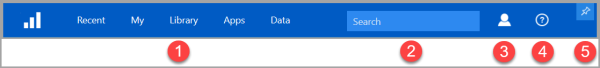
The header/toolbar appears at the top of the application and is used to access the key functions within the software. The key areas are:
|
|
Menu options/drawers |
|
|
Search |
|
|
Manage Account |
|
|
Help |

|
Pin/Unpin |
2. Using Tabs
IRIS Analytics provides a multi-window environment. Tabs function in a similar way to internet browser tabs enabling you to switch between windows.
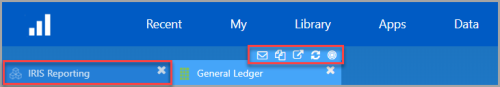
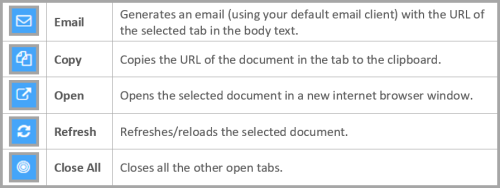
Select a tab to switch to that view. Hovering over a tab provides access to an additional set of options:
![]()
3. App Panel
The App panel is displayed when an app is selected (accessed via the App drawer on the header). It is labelled according to the app selected and provides access to the various documents available.
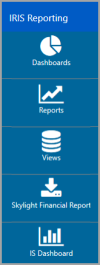
The following options are available:
Dashboards
![]()
The Dashboards icon provides access to a collection of dashboards which display a range of KPIs enabling the monitoring of progress towards a set target.
Once clicked, the icon minimises and the available dashboards are displayed immediately below - click a dashboard name to select it. Click the arrow icon adjacent to the Dashboards heading to return to the App panel.
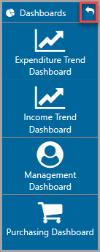
For more information, refer to Overview of Dashboards.
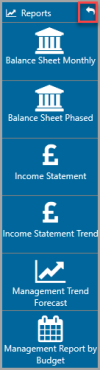
Reports
![]()
The Reports icon provides access to the published reports available to you. Reports are created/amended using IRIS Analytics and Microsoft Excel. Once the final report has been completed, it is published from Excel to IRIS Analytics and is then available to all applicable users. For more information, refer to Overview of Published Reports.
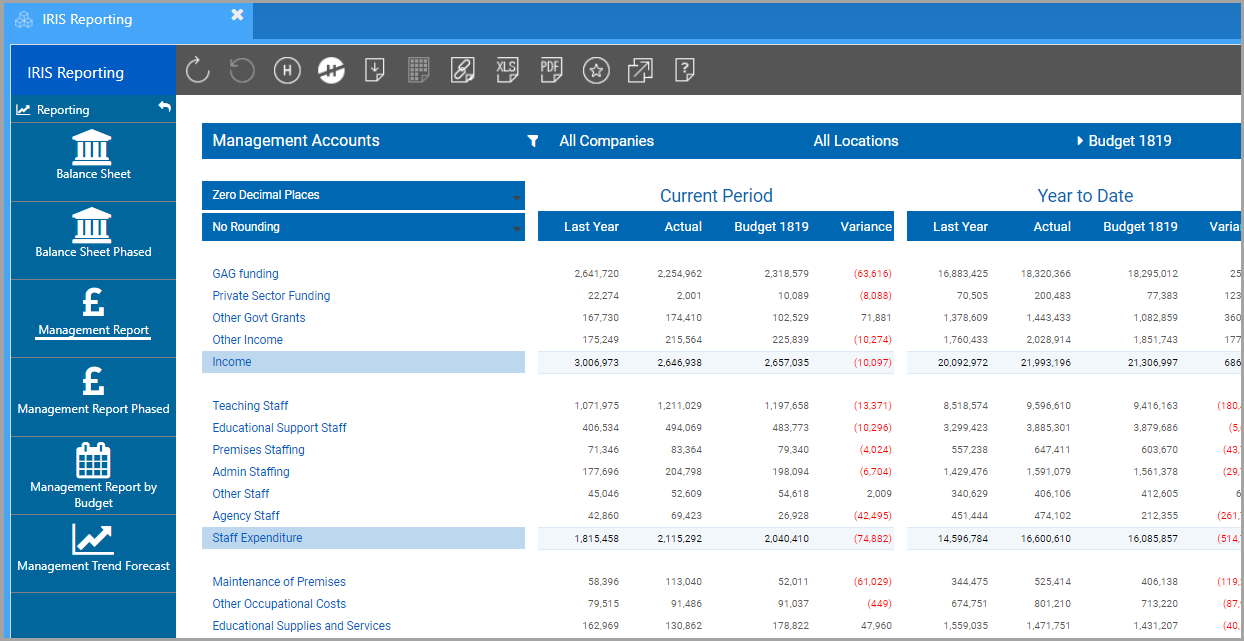
Once clicked, the icon minimises and the available reports are displayed immediately below. Click a report name to open it. Click the arrow icon adjacent to the Reports heading to return to the App panel.
Views
![]()
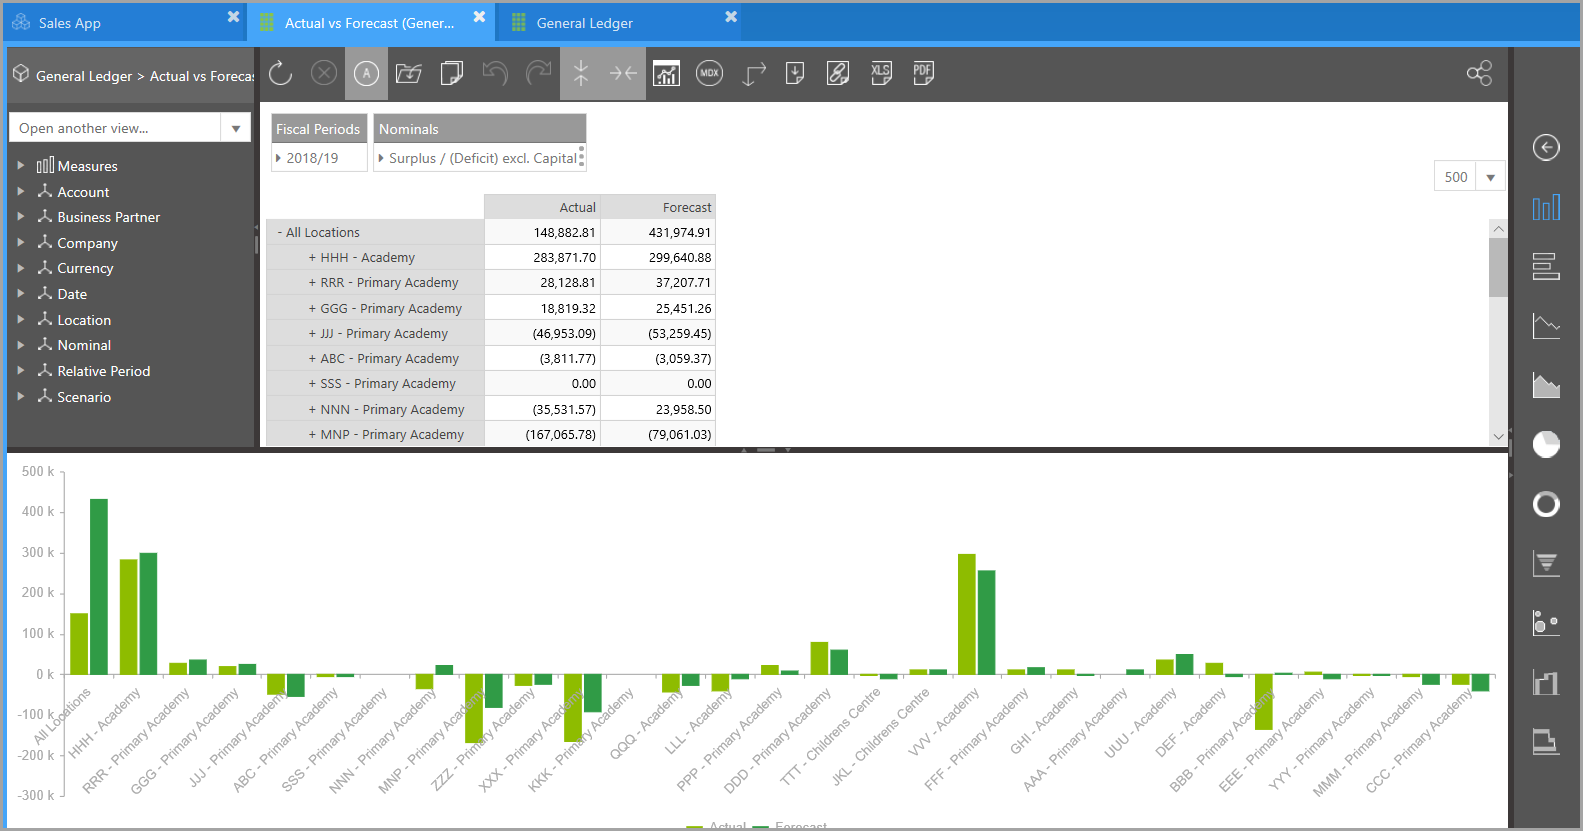
The Views icon provides access to a collection of data views. A data view is effectively a saved Data Explorer session, which provides a way of analysing and visualising your data. They include a navigation tree for selecting data, rows and columns of data, and can also contain charts as shown in the following example:
Once clicked, the icon minimises and the available views are displayed immediately below - click a view name to select it. Click the arrow icon to return to the App panel.
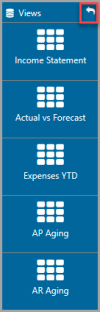
For more information, refer to Overview of Data Views or Viewing or Editing Existing Data Views.
Skylight Financial Reports
![]()
Using an Office add-in for Microsoft Word and PowerPoint, it is possible to insert a picture of a report/report section into a Word document or PowerPoint slideshow. This picture is referred to as a Skylight. The picture is treated as a dynamic web page enabling the data in the picture to be refreshed by retrieving the latest data from IRIS Analytics.
For more information, refer to Overview of Skylights.
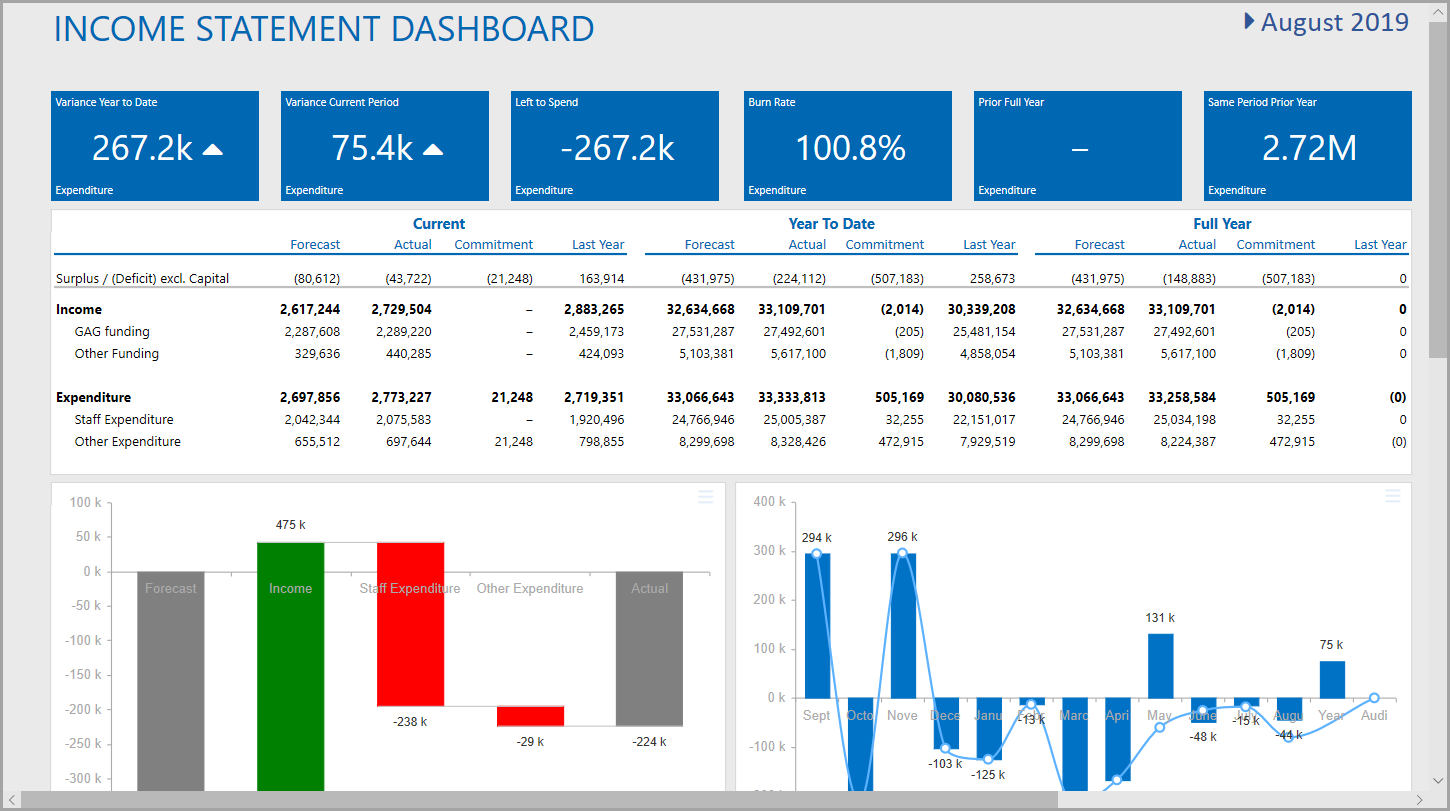
IS Dashboard
Select this icon to access the Income Statement dashboard.
4. Working Area
The content of the working area part of your screen will vary from reports, data views and dashboards depending on what options are selected from the App or Data panel, as you navigate through the software.
The default screen displayed when you first logon is determined by the person who administers your system, typically a dashboard.