Overview of the Data Explorer
The Data Explorer is the interface used to view and explore your data. It is accessed by selecting the Data drawer on the header at the top of the application.

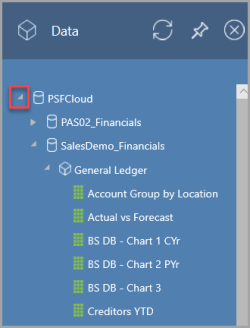
The Data panel is displayed showing a navigation tree of available data views that can be selected.

Select an existing data view from the navigation tree or click the General Ledger cube to create a new data view.
The Data Explorer consists of the following components:


|
The data view is displayed in a separate tab which shows the data view name. |

|
The navigation tree is used to select the data on which to report. Items can either be dragged onto the data view or clicking the item opens the Member Explorer enabling more specific data to be selected. |

|
Data that you want to appear as rows in the data view should be dragged onto this area. |

|
Data that you want to appear as columns in the data view should be dragged onto this area. |

|
Slicers are used to restrict the data to certain criteria. They appear as drop-down lists in the data view. |

|
The data view toolbar provides access to a variety of additional options. For more information, please see the Data View Toolbar. |
