Creating a New Data View
Data views are created in a very similar way to Excel pivot tables.
Once created, additional actions can be carried out to interrogate the data further. For more information, refer to Viewing an Existing Data View.
Creating a New View
- A new data view is created by selecting the Data drawer on the header/toolbar at the top of the application.

- The Data panel is displayed, providing a navigation tree which can be expanded to show a list of the available data views that can be selected. Click the arrow adjacent to each item to expand the list.
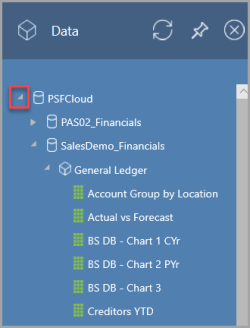
- To create a new data view, click the General Ledger cube heading in the Navigation Tree.
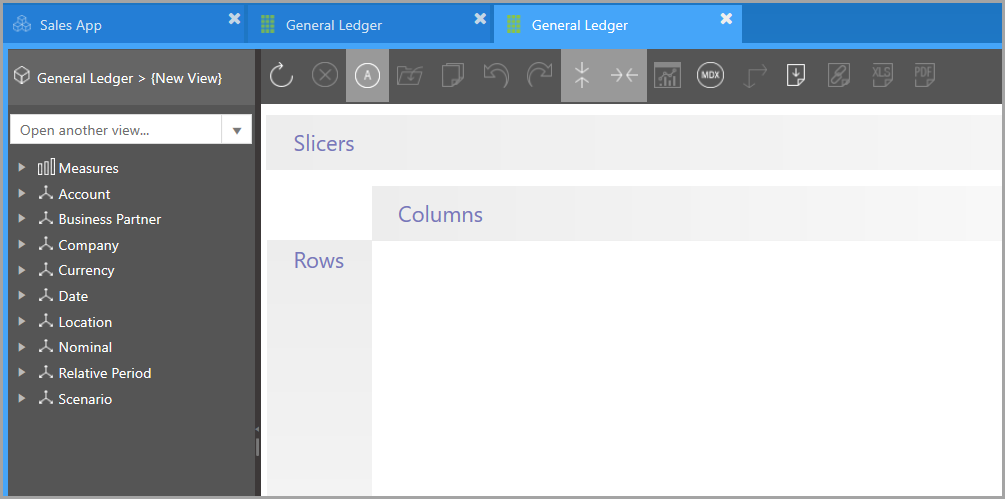
If you already have a data view displayed, you will need to click the General Ledger heading as shown in the following graphic. A new data view is then created on a separate tab.
A new and empty data view is displayed.
Adding Data to Rows and Columns
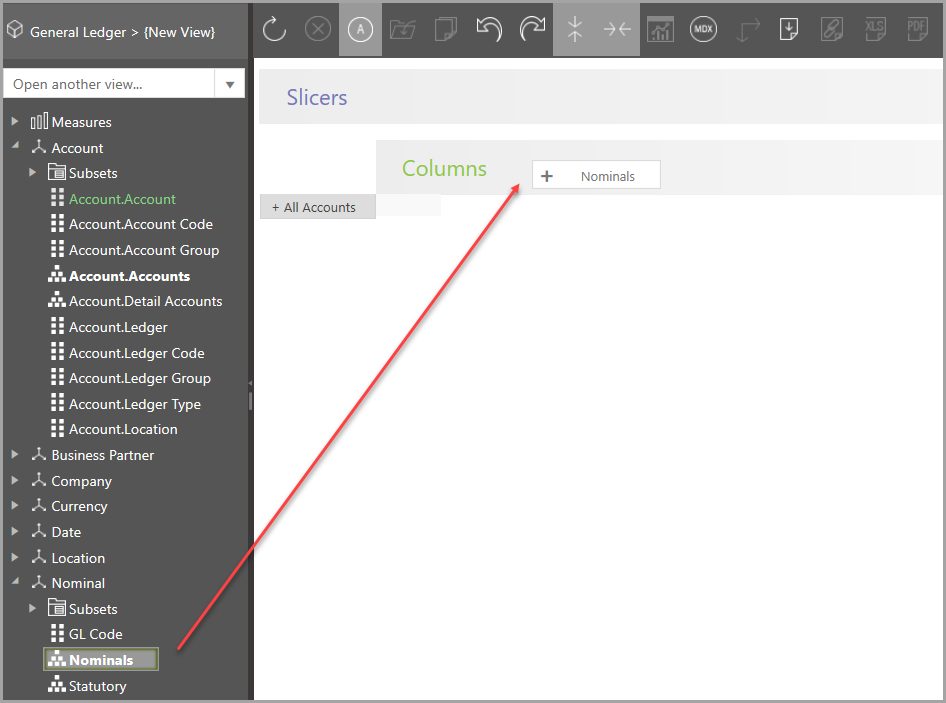
Expand the navigation tree in the data view to identify the required dimension or hierarchy, then drag onto either the Columns or Rows section of the data view as shown in the following graphics:
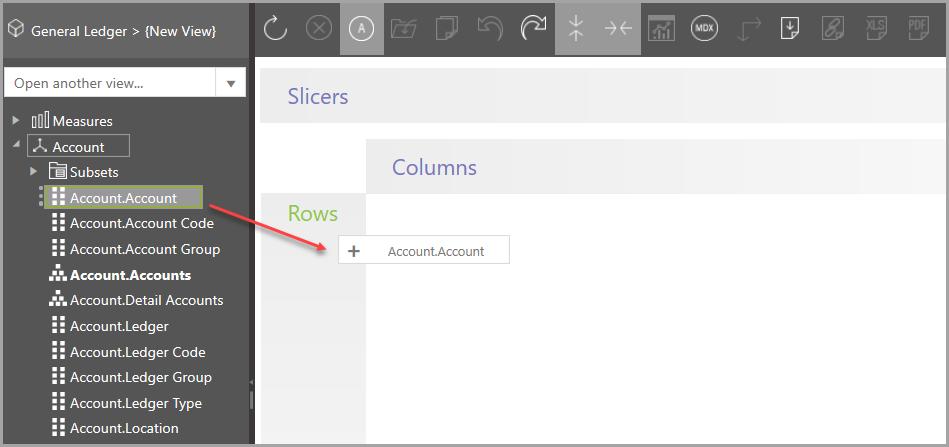
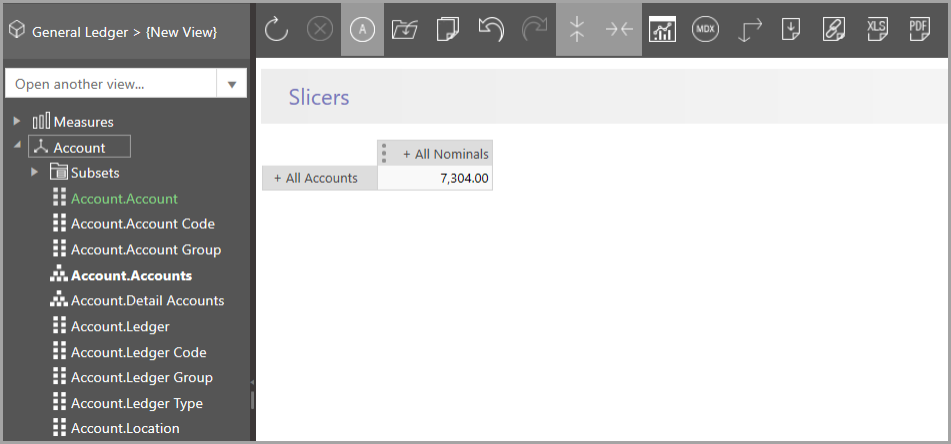
Once dragged onto the rows or columns, the data/values update accordingly as shown in the following graphic.
Repeat until the required data has been added to the view.
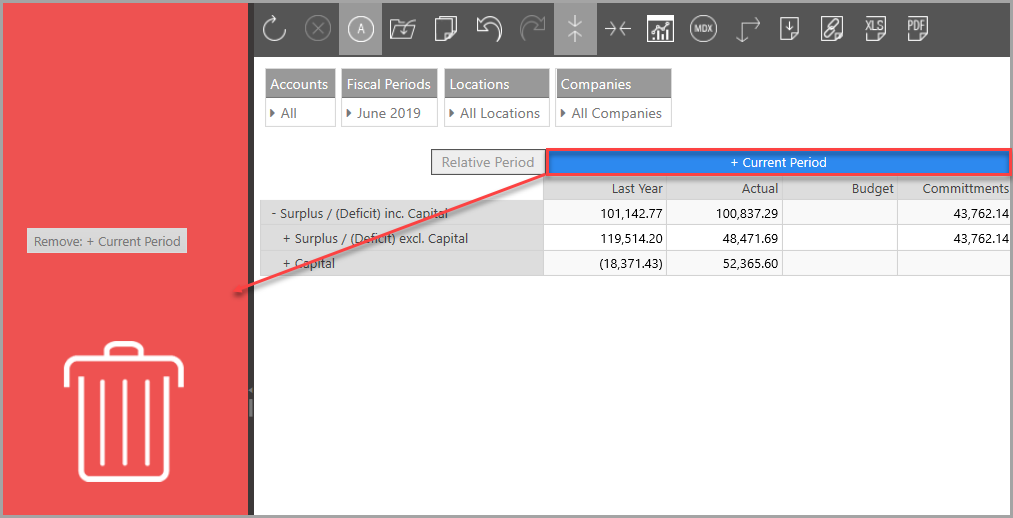
Removing Data from Rows and Columns
If any data is no longer required, either click the Undo icon on the toolbar, or drag the required heading onto the Navigation Tree (which will turn red).
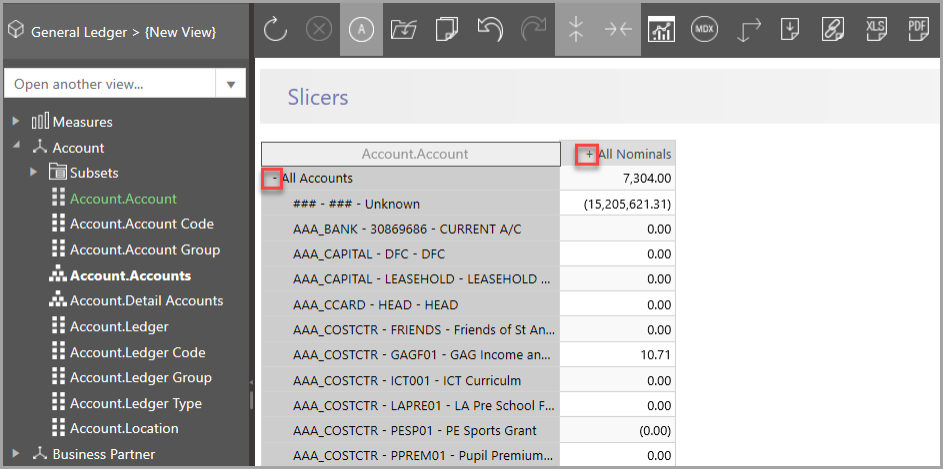
Expanding Hierarchies/Lists
The data can be expanded by clicking the + icon adjacent to each hierarchy then contracted by clicking the - icon.
Selecting Members and Applying Filters
Once a hierarchy has been added to the data view, you can hover over the hierarchy then click the three dot icon to view a list of options enabling the selection of one or more members of the hierarchy.
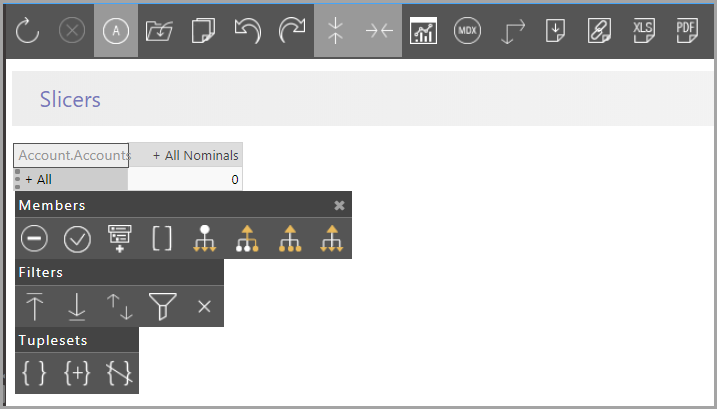
The following options are available:
|
|
Exclude the currently selected members. |
|
|
Include the currently selected members. |

|
Move this member to a slicer/drop-down list. |

|
Clears all spreading holds on the dashboard. |

|
Show only the leaves for this member. |
|
|
Insert the parent for this member. |
|
|
Insert the parent and siblings for this member. |
|
|
Insert the parent and children for this member. |
In addition, you can also apply filters to the hierarchy:
|
|
Top Count - Sort the results by value, then displays the top number you specify. Enter/scroll the value then click the Tick icon.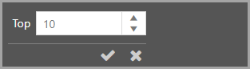 |
|
|
Bottom Count - Sort the results by value, then displays the bottom number you specify. Enter/scroll the value then click the Tick icon.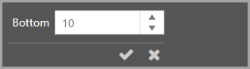 |
|
|
Sort - Open sort options which include ascending or descending order. Select the Keep Hierarchy check box if you only want to sort the members within the current level of the hierarchy, otherwise the sort will be
carried out on all members of the hierarchy.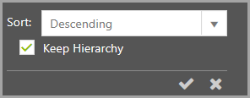 |
|
|
Filter - Filter the results based on an expression (or MDX statement for advanced users). Select the type of expression from the drop-down list then enter the required value, e.g. > then 10,000.00. |

|
Clear all filters - Remove any previously set filters. |
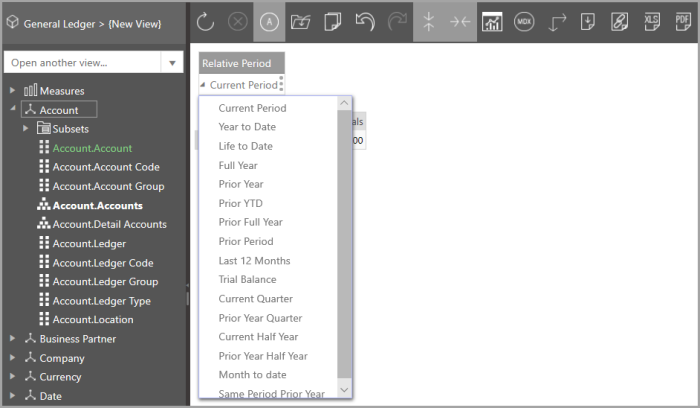
Adding Slicers (Drop-Down Lists)
Slicers are added by dragging the dimension onto the Slicers panel.
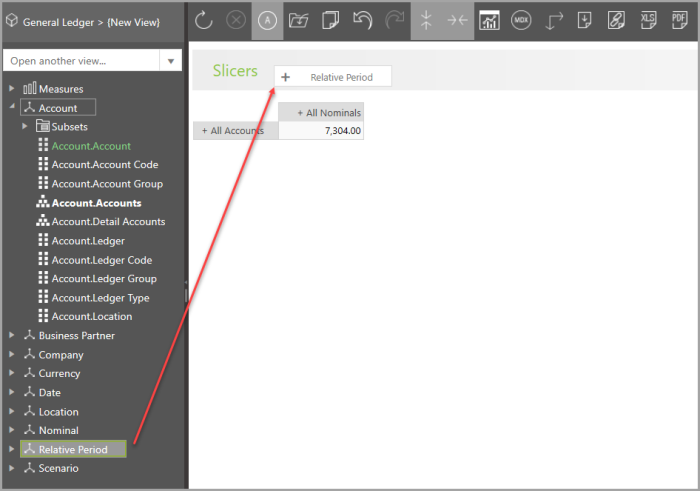
The slicer can then be clicked on and the required value selected from the drop-down list.