What are the Key Reporting Outputs?
There are various reporting outputs available in IRIS Analytics as follows:
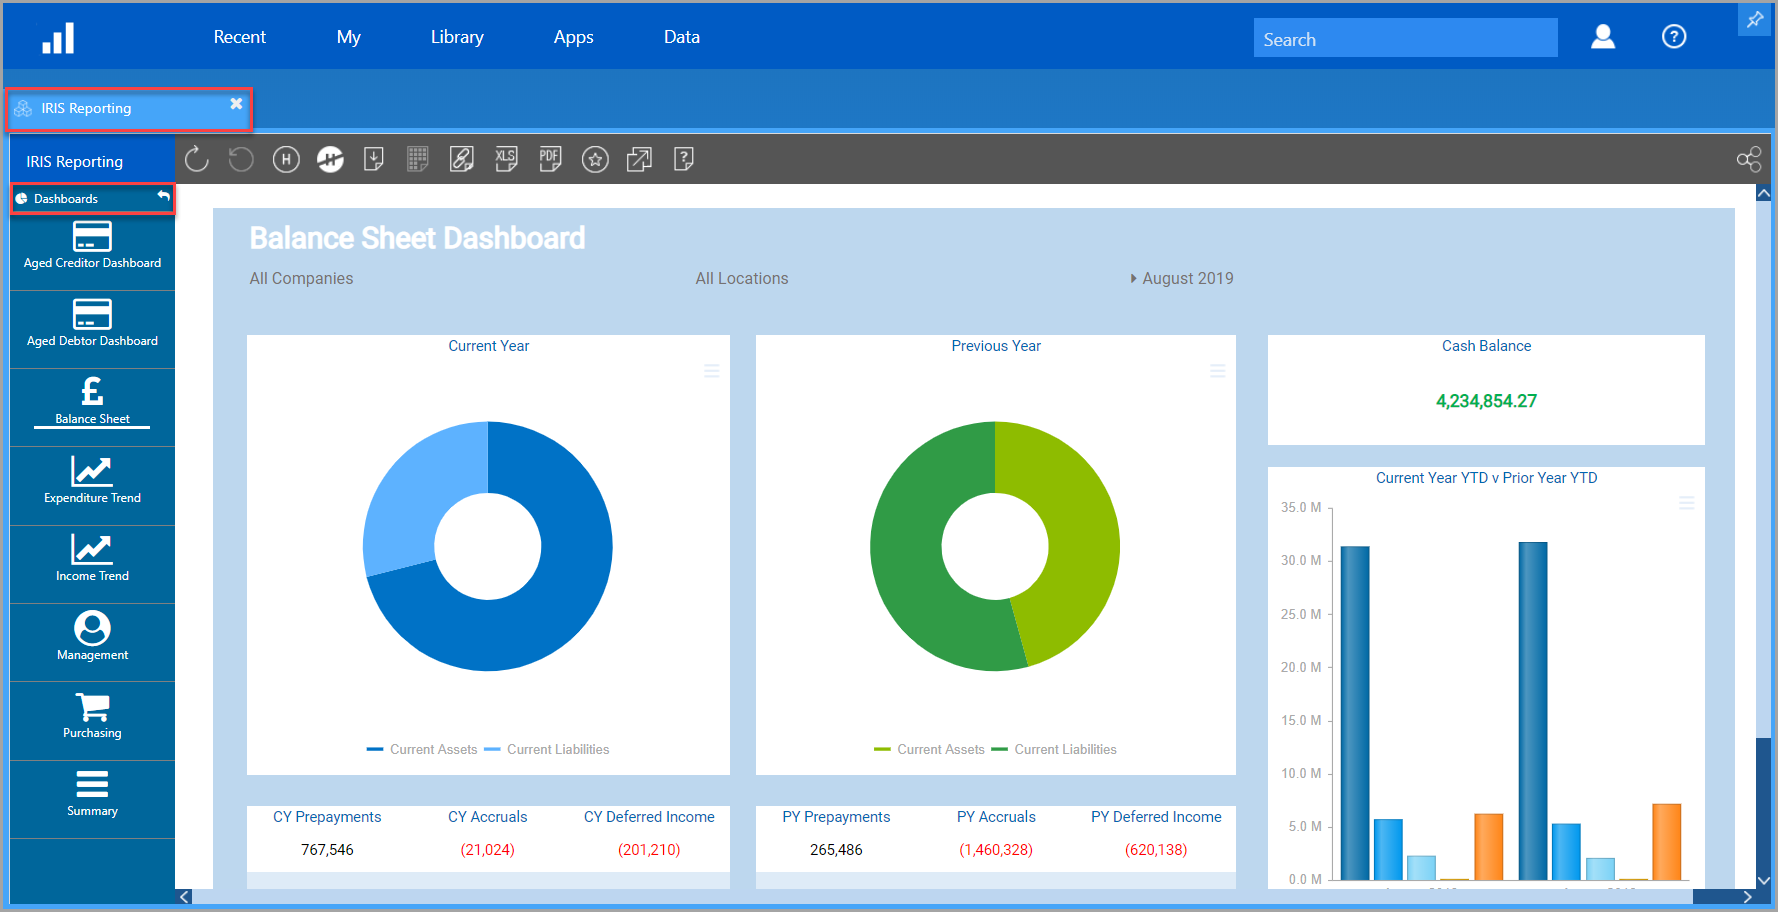
Dashboards
Dashboards provide a read-only view of selected data. Depending on the dashboard, you can select different timeframes, budgets, etc. and you can also drill down to see further detail. A variety of dashboards are supplied with this application. For more information, refer to Viewing and Using Dashboards.
Data Explorer/Data Views
The Data Explorer is the interface used to view and explore your data. Once the required data is displayed, it can be saved as a data view for future use. A data view can also be saved as a published report which can be further analysed using Microsoft Excel. A variety of data views are supplied with this application.
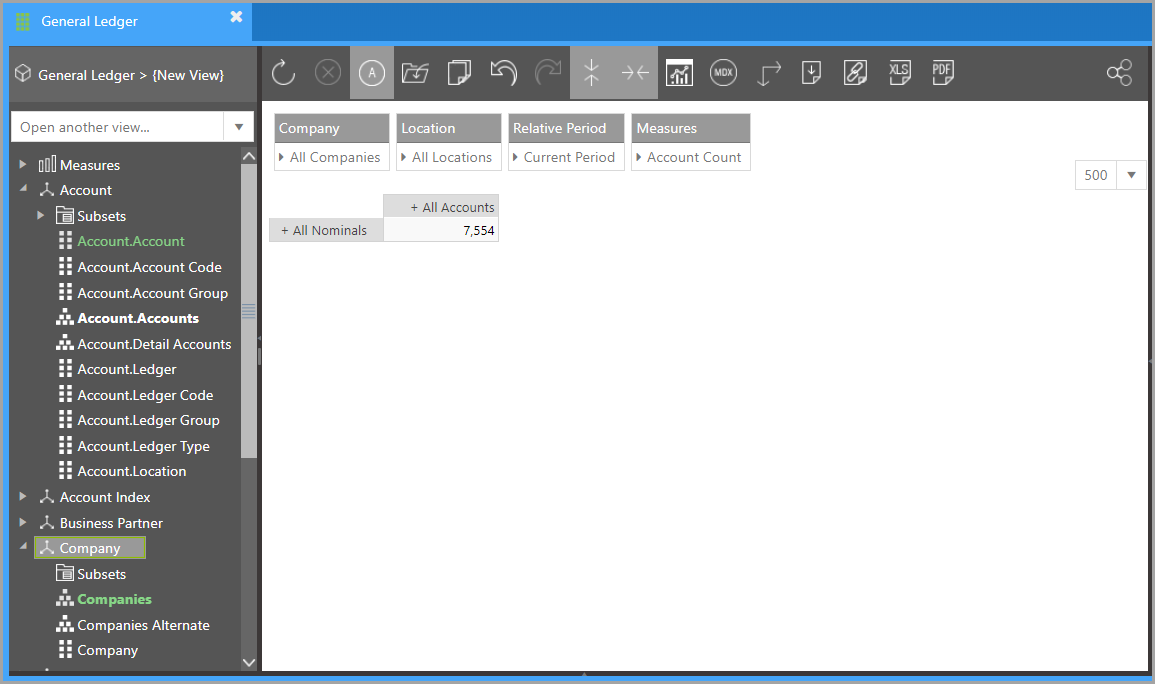
For more information, refer to Using the Data Explorer.
Reports
Reports are created/amended in association with Microsoft Excel. They are usually created from a data view and then edited in Excel. Once the final report has been completed, it is published from Excel to IRIS Analytics and is then available to all applicable users. A variety of reports are supplied with this application.
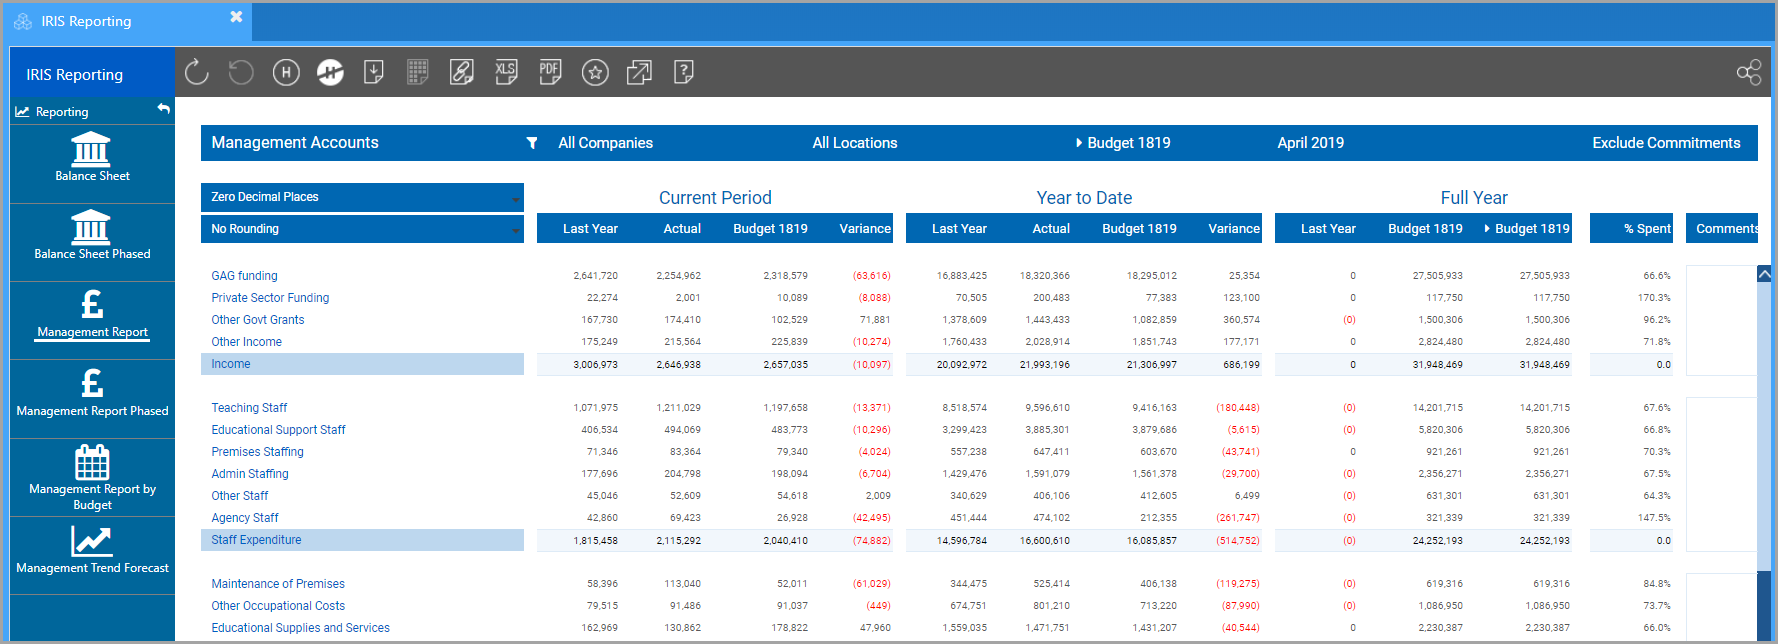
For more information, refer to Overview of Published Reports.
Skylights
Using an Office add-in for Microsoft Word and PowerPoint, it is possible to insert a picture of a report/report section, into a Word document or PowerPoint slideshow. This picture is referred to as a Skylight. The picture is treated as a dynamic web page, enabling the data in the picture to be refreshed by retrieving the latest data from IRIS Analytics. This ensures that documents and slideshows are always up to date and don't need to be produced from scratch.
For more information, refer to Overview of Skylights.