 |
 |
|
|
The Billing Dashboard shows the clients’ fees for the selected period, fees to date against the total fees budget for the year and all again for the prior year where the history is available.
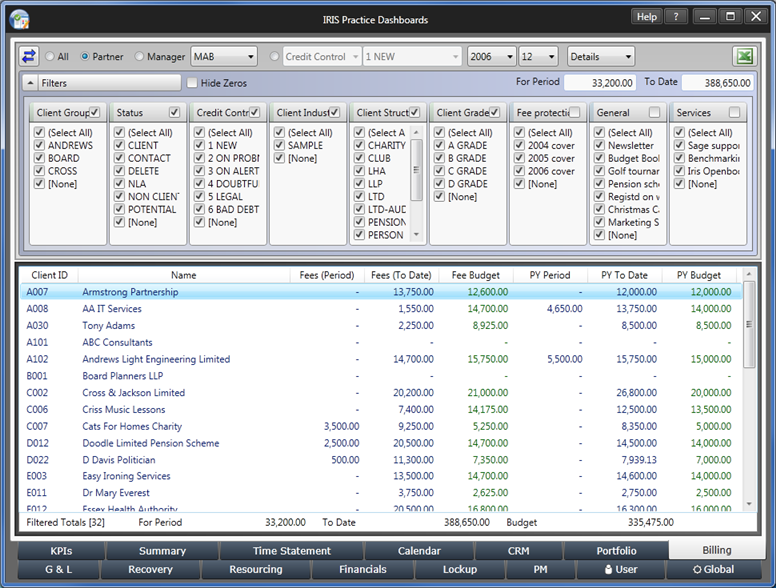
The partner, manager, user selected category and the filters are all taken direct from your IRIS database setup as explained in Figure 9 and Figure 14 and all the available features are discussed in more detail in the Portfolio Dashboard as these Dashboards all work in the same way.
The results in the details screen are clickable to show the breakdown of the fees billed to date and their recovery, all amounts shown are net of VAT.
All the information displayed in the Billing Dashboard is automatically populated from IRIS, there is no setup required in the IRIS Practice Dashboards itself, this Dashboard relies totally on your IRIS database setup and usage except for the clients’ fee budgets.
The clients’ fee budgets are currently stored within IRIS under the Time Ledger rather than the Fees Ledger as there is no corresponding feature available in the Fees Ledger at this time. We took feedback from multiple practices and it was felt that having fee budgets was more useful than time budgets.
Entering the fees budgets can be time consuming and a little complicated. To assist with this, there is a detailed explained in Figure 15.
The details screen view can be changed to a summary screen view by using the drop down on the main bar. The view will change to a pie chart summary for the detailed results. You can select between partner, manager and your user selected category. The pie charts are clickable and provide mouse over results.
The Billing Dashboard details screen view can also be changed to a services screen view by using the drop down on the main bar. The view will change to the screen shown above.
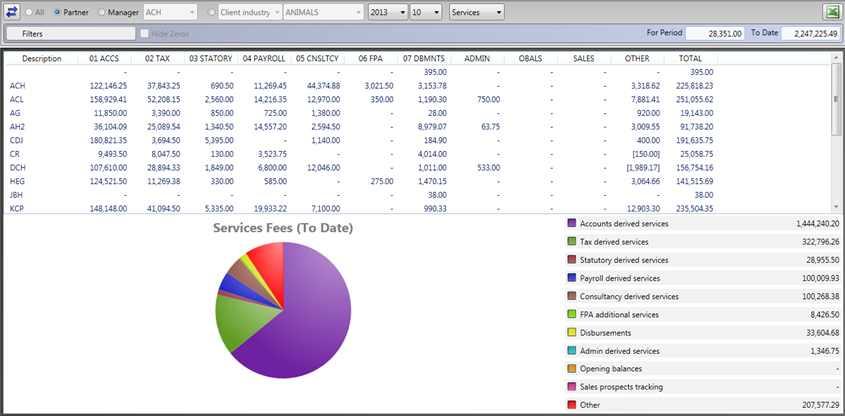
You can select between partner, manager and your user selected category.
The pie chart and colour coded summary bar report on the total results line by default but will also change to report on the results of each of the individual description lines when selected with your mouse.
The pie chart has a mouse over results feature which tells you the name, value and percentage of the component part.
All the information displayed in the Billing Dashboard services screen view is automatically populated from IRIS, there is no setup required in the IRIS Practice Dashboards itself, this Dashboard relies totally on your IRIS database setup.
You will need to allocate all of your client job types in to client job groups as explained further in Figure 2.