Working with Reports in Excel
Once a report or data view has been sent to Microsoft Excel, the additional spreadsheet functionality becomes available. Typically, a data view would be created in IRIS Analytics which would then be sent to Excel. The spreadsheet would then be edited to create the required report, and published back to IRIS Analytics.
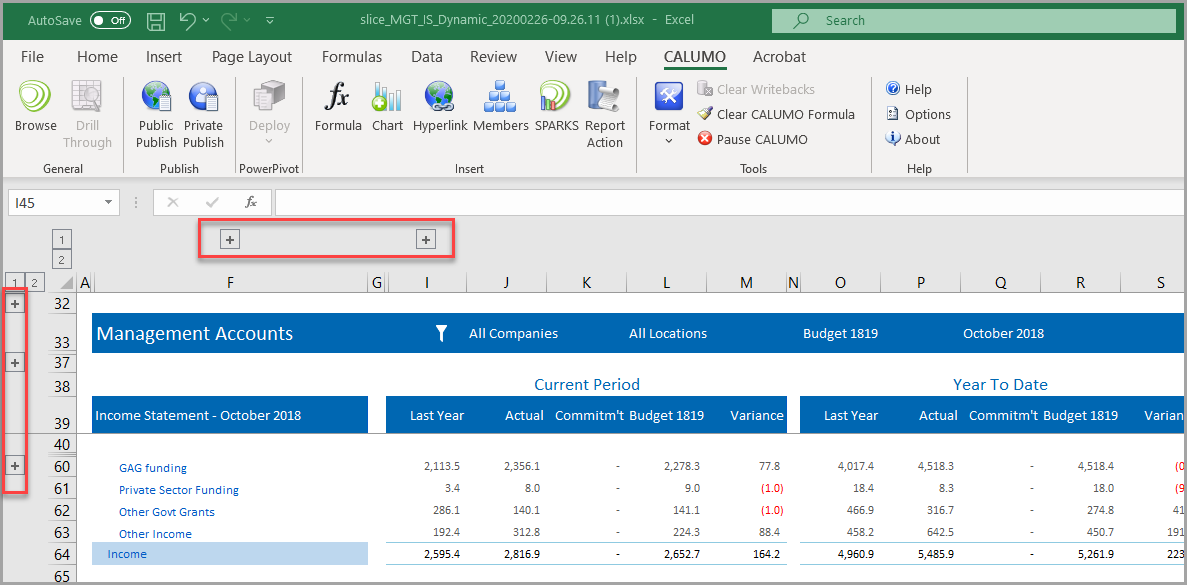
All the 'behind the scenes' details and formulae are automatically hidden, but can be viewed by clicking the applicable + icon above/beside the required column/row.
- All the usual formatting features available in Excel can be used including fonts, colour, size, borders, fills, etc.
- You can insert your own formulae, if for example, you want to add a variance column to the report.
- Other options are available from the CALUMO ribbon. For more information, please see The Excel Client Ribbon.
- For more information on what can be achieved in Excel, click the Help icon on the CALUMO ribbon.