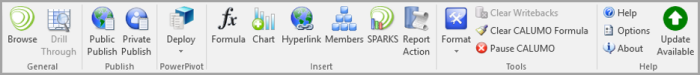
Excel Ribbon Icons
The IRIS Analytics functionality available in Microsoft Excel can be accessed via a toolbar ribbon called CALUMO (which powers IRIS Analytics).
|
|
Opens IRIS Analytics in your default internet browser. This enables you to either create a new data view or to select an existing report to send to Excel. |
|
|
This icon is enabled where a cell is highlighted that can be drilled to view the transactions that form the basis of that particular cell. For more information, please see Drilling for Further Data in Excel. |

|
Publishes the current worksheet as a public report which will be available from the Library drawer in IRIS Analytics. Only users with Publish permissions can use this function. For more information, please see Publishing a Report from Excel to IRIS Analytics. |
|
|
Publishes the current worksheet as a private report which will be available from the My drawer. For more information, please see Publishing a Report from Excel to IRIS Analytics. |
|
|
Not applicable. |
|
|
Discover and insert formula from IRIS Analytics. Click the Help icon on the ribbon for more information. |
|
|
Inserts an interactive chart for use in an IRIS Analytics report. |
|
|
Add a hyperlink to be added to another report or data. |
|
|
Select members from any hierarchy and insert the selection into the current worksheet cells, either horizontally or vertically. |

|
Create in-cell charts including Axis, Bar, Bullet, Grid, KPI, Line, Pie, Progress, Strip and Trend Arrow charts. |

|
Components you can add to your report to perform specific tasks. The task is backed by a Stored Procedure that you have written and authorised. |
|
|
Formats the numbers in your worksheet. |
|
|
Cancel your writeback changes so that your data reverts to its state since the last calculation (applicable to unsaved data only). |
|
|
Clears all of the formulas in an Excel worksheet, giving you the option of saving it to a new workbook or clearing your existing one. |
|
|
Pause or resume the CALUMO calculation engine. |
|
|
Access help on the functions available in Excel. |
|
|
Edit the connection settings. |