Using the Data Explorer Navigation Tree
The navigation tree is displayed on the left-hand side of the Data Explorer and is used to select the dimensions, hierarchies and members to be included in a report.
If required, the width of the navigation tree can be changed by dragging the dark grey boundary bar to its desired location.
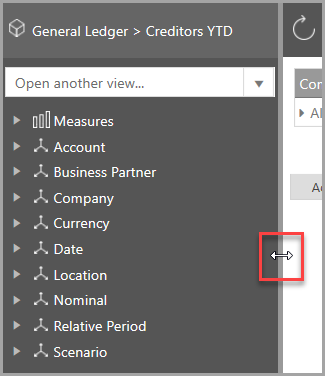
Clicking the triangular symbol expands the tree to show further levels beneath.
Please choose from the following options:
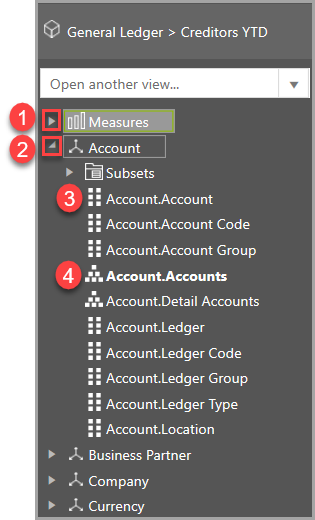
1. Selecting Measures
![]()
Items with this symbol are measures and will include a numerical value in the data view, such as cost of sales, cost centre balance, etc. Expand the list as required, then drag the required measure onto the data view.
2. Selecting Dimensions
![]()
Items with this icon are dimensions. They can either be dragged onto the data view themselves (to include all their members), or the dimension can be expanded and the required member(s) or hierarchies can then be dragged onto the report. For example, you could drag the Nominals dimension onto the data view to include all nominals.
3 & 4. Selecting Member Hierarchies
Thee are two key types of hierarchy used in the system, identified by two different icons as follows:
![]()
These can either be dragged onto the data view, or clicking on them opens the Member Explorer enabling specific members within the hierarchy to be selected. For more information, refer to Using the Member Explorer.