 |
 |
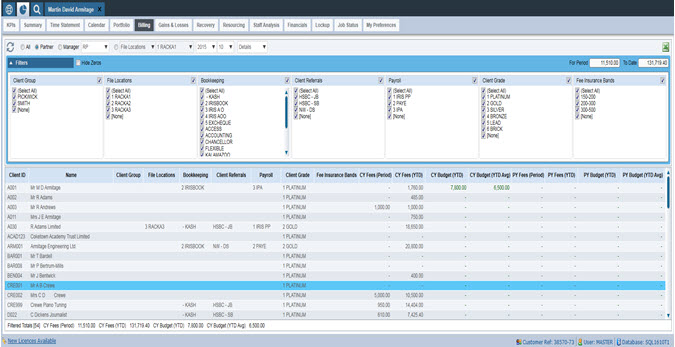
The Billing Dashboard shows the clients’ fees for the selected period, fees to date against the total fees budget for the current year and all again for the prior year where the history is available.

The partner, manager, user selected category and the filters are discussed in more detail in the Portfolio dashboard as they work in the same way.
The results in the details screen are clickable to show the breakdown of the fees billed to date and their recovery, all amounts shown are net of VAT.
All the information displayed in the Billing dashboard is automatically
populated from IRIS Time & Fees, there is no setup required in the
IRIS Practice Dashboards Settings itself.
The different columns displayed in the Billing dashboard are as below:
Client ID - a unique Client Identifier.
Client Name - the name of the client which can be a person, business or trust.
Client Group - is a user defined id that enables clients of similar nature to be grouped together for reporting purposes.
Category 1 – 6:
Client categories are a flexible method of organising clients into groups for reporting purposes. Client categories can be configured within System Maintenance | Practice tab | Practice Options | General tab | Enter the names of the category fields in Client category field usage group.
The client categories can be set in Client
Maintenance | Categories
tab
CY Fees (Period) - column displays the current year’s total billings for the period.
CY Fees (YTD) - column displays the current year’s total billings for the year to date.
CY Budget (YTD) – the current
year Fees budgets are entered in IRIS
Fees | Budgets | Client's Budget
The current year Budget (YTD) shows the totals YTD for each of the specific
periods up to the one selected.
The formula is as follows:
Sum of the budgets for
current years up to the selected period
For example, Fees budgets entered for 12 period’s in the Fees ledger is, 10, 20, 30, 40, 50, 60, 70, 80, 90, 100, 110 and 120
Calculations for period
5: “CY Budget (YTD)” is 10+20+30+40+50 = 150
CY Budget (YTD Avg) - the current year Fees budgets are entered in IRIS Fees | Budgets | Client's Budget
The CY Budget column is a year to date figure which can be compared
to CY Fees (YTD) column.
The formula is as follows:
(Sum of the budgets for
current years / 12) * selected period number = CY Budget (YTD Avg)
For example, Fees budgets entered for 12 period’s in the Fees ledger is, 10, 20, 30, 40, 50, 60, 70, 80, 90, 100, 110 and 120
Calculations for period
5: “CY Budget (YTD)” is ((10+20+30+40+50+60+70+80+90+100+110+120)/12)
* 5 = 325
PY Fees (Period) - column displays the previous year’s total billings for the period
PY Fees (YTD) - column displays the previous year’s total billings for the year to date.
PY Budget (YTD) - the previous year Fees budgets are entered in IRIS Fees | Budgets | Client's Budget
The previous year Budget (YTD) shows the totals YTD for each of the specific periods up to the one selected.
The formula is calculated the same way as CY Budget (YTD) but for the prior year.
PY Budget (YTD Avg) - the previous year Fees budgets are entered in IRIS Fees | Budgets | Client's Budget
The formula is calculated the same way as CY Budget (YTD Aug) but for
the prior year.
Within the Billing dashboard, there is an option for all the columns
in the dashboard to be exported to excel. To do this click the  icon next to the drop-down
on the main bar.
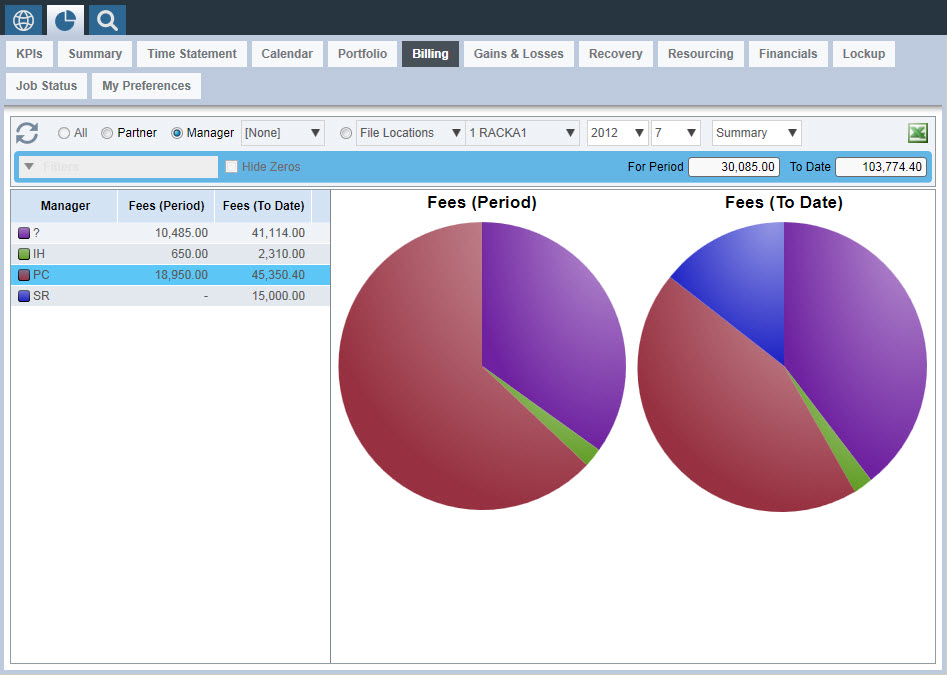
The details screen view can be changed to a summary screen view by using the drop down on the main bar. The view will change to a pie chart summary for the detailed results. You can select between partner, manager and your user selected category. The pie charts are clickable and provide mouse over results.

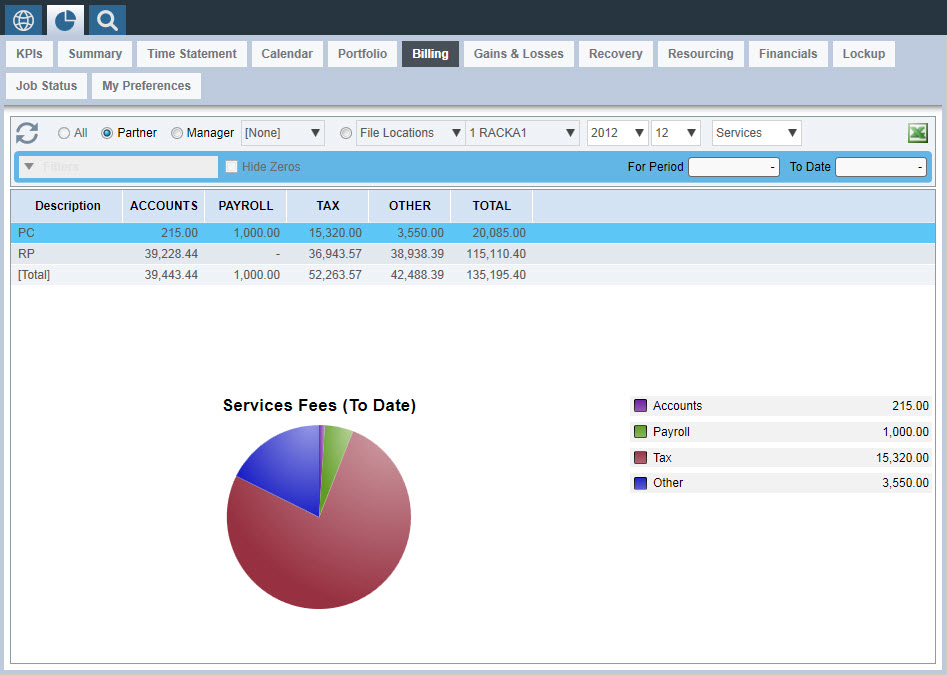
The Billing Dashboard details screen view can also be changed to a services screen view by using the drop-down on the main bar. The view will change to the screen shown below.
You can select between partner, manager and your user selected category.
The pie chart and colour coded summary bar report on the total results line by default but will also change to report on the results of each of the individual description lines when selected with your mouse.
The pie chart has a mouse over results feature which tells you the name, value and percentage of the component part.
You will need to allocate all of your client job types in to client job groups. This can be done in System Maintenance | Practice | Job Types / Profiles
