 |
 |
|
|
The Resourcing Dashboard shows the team’s time required to deliver the fees billed for the selected year and portfolio.
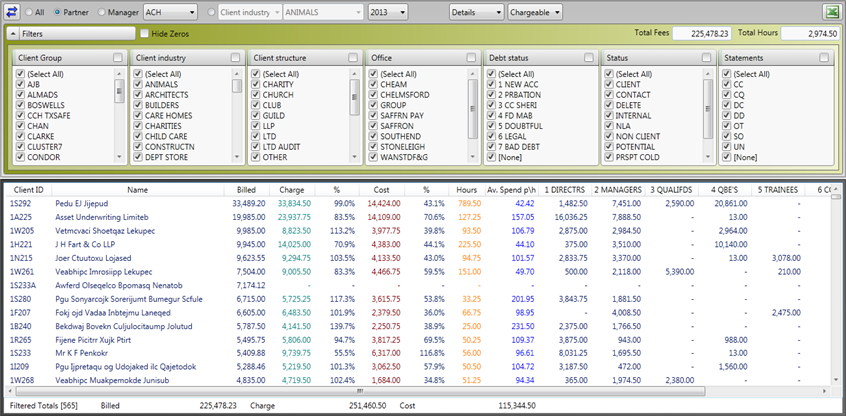
The time value is calculated on the charge out rates and cost rates (where set up) of the team that delivered the client service. These time values are compared against the fees billed to give a % recovery rate based on chargeable time and a % production rate based on cost rate time. The hours column is the total number of hours input.
The drop down on the main bar at the top of the Dashboard allows you to select between Chargeable, Cost and Hours analysis. This selection will change the analysis view of how the value or time was split between the different Team functions or hierarchy.
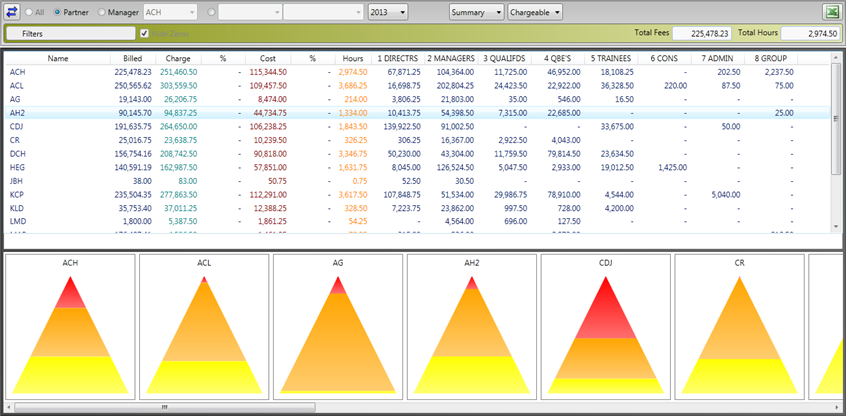
The details screen can be changed to a summary view where the team analysis is shown in a pyramid form to help the user assess whether that portfolio was delivered with the best use of the Practice’s resources. This is incredibly powerful when comparing portfolios at partner, manager or office level.
The team analysis is setup within your IRIS database and explained further in Figure 8.
If you are going to use the cost rates features of IRIS and the IRIS Practice Dashboards within a Practice, you need to consider who and how you restrict this very sensitive information. The IRIS setup is explained further in Figure 11 with notes on how to put the IRIS cost rate controls in place. Make sure you run some IRIS Time Ledger reports and check the IRIS software access areas on a user where you have enabled the restrictions so that you are confident they are working.
The Resourcing tab as with nearly all the Dashboards can be completely removed from view for any user as part of the user permissions area of the Global Dashboard set by the IRIS Practice Dashboards administrator.