Drilling Down or Through to Transactional Data
In various areas of data views, charts and reports, it is possible to drill down to interrogate the data further. By drilling down, you can view the subsets of data, or transactions that contributed to the data point. For example, if you were to view the total sales for the UK, drilling down would allow you to interrogate the total sales for each county.
For more information on drilling in Excel, please see Drilling for Further Data in Excel.
Drilling Down in Dashboards
Typically with dashboards, drilling is carried out on charts. Simply click the element of the chart that you want to investigate further. The chart will then be reproduced to reflect the new data selection.
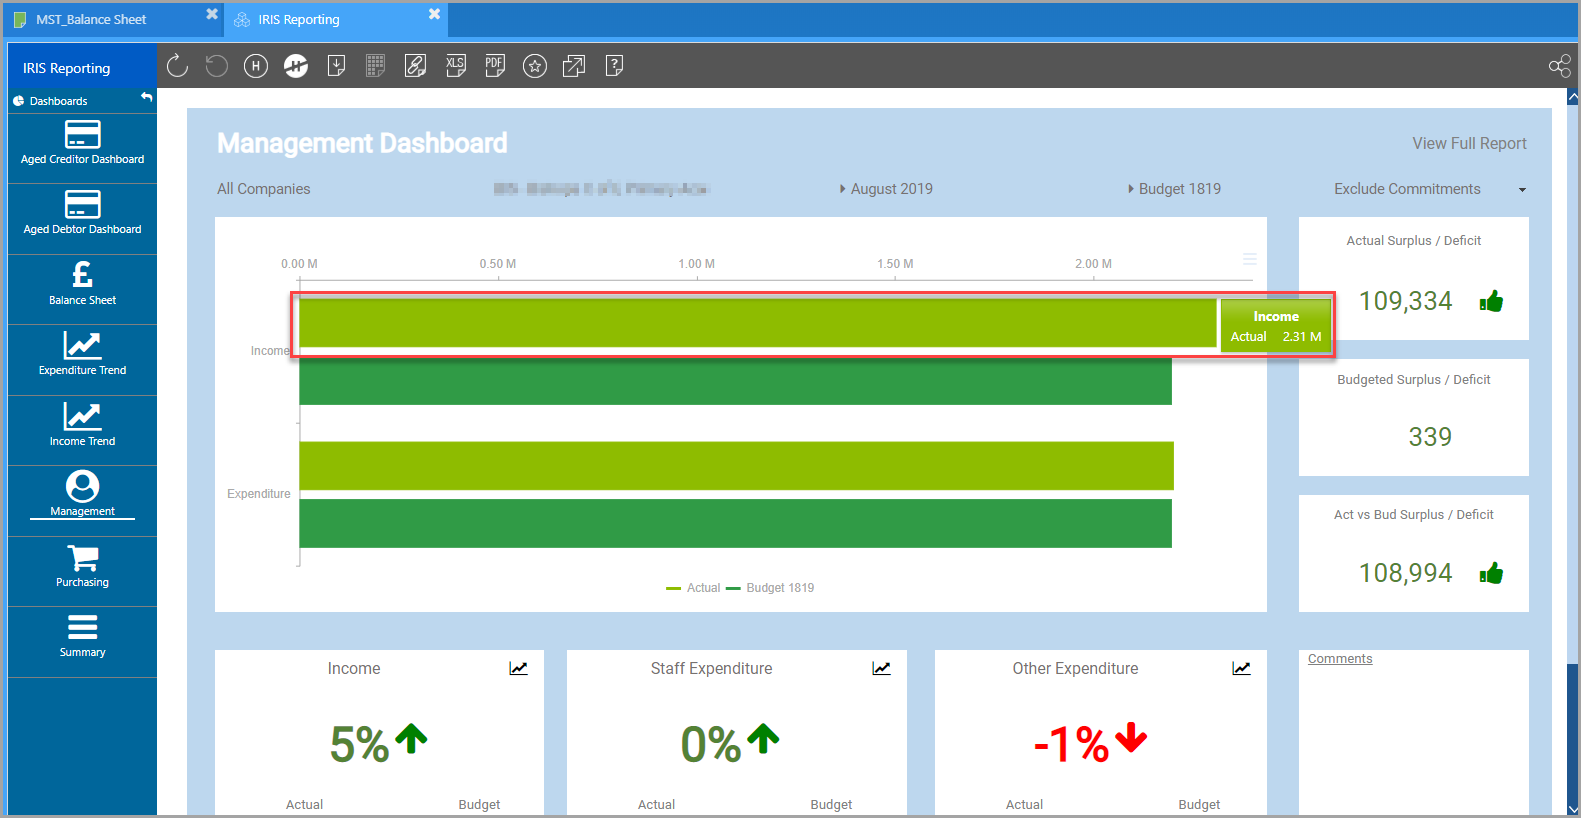
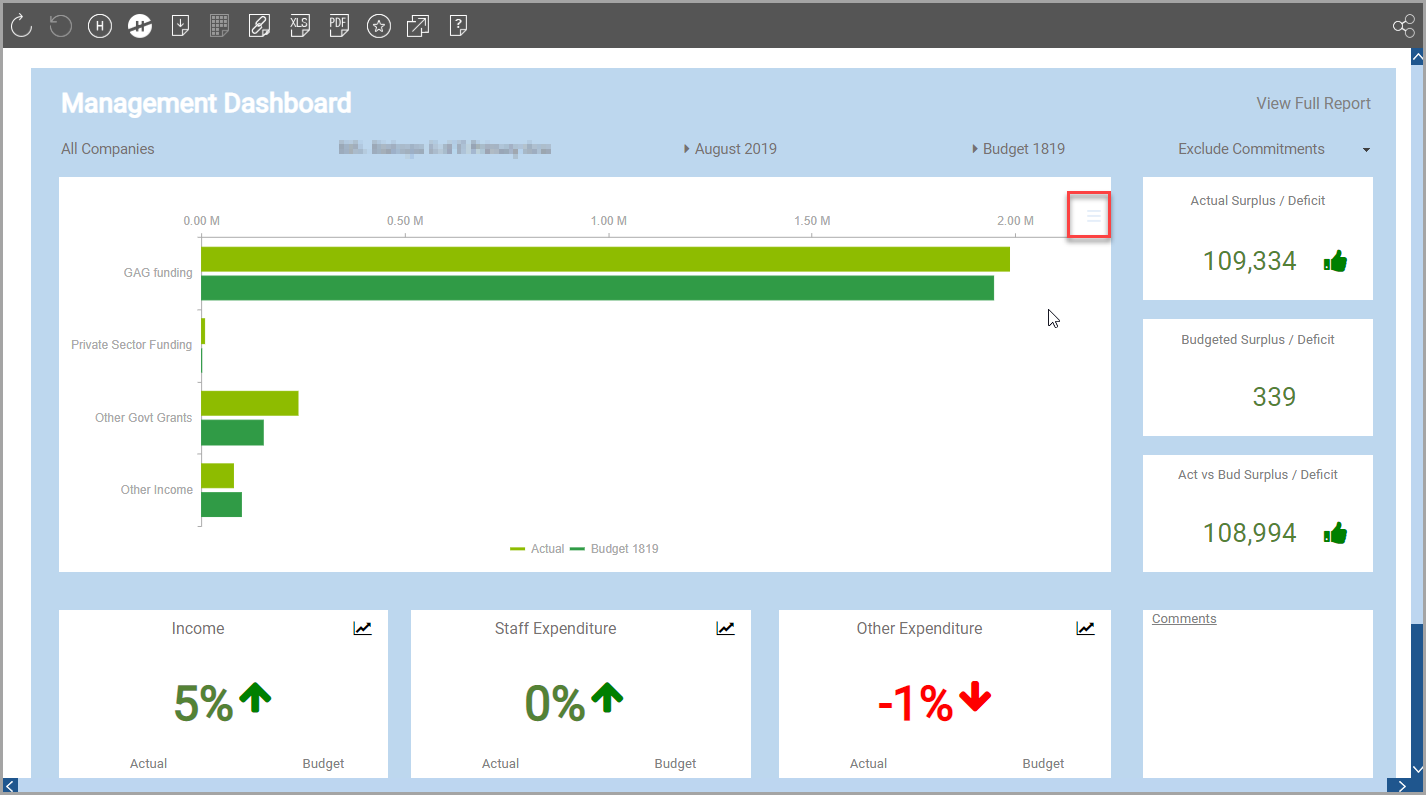
Where relevant, applicable figures will update in the report to reflect the drilled data.
Drilling Down in Data View Charts
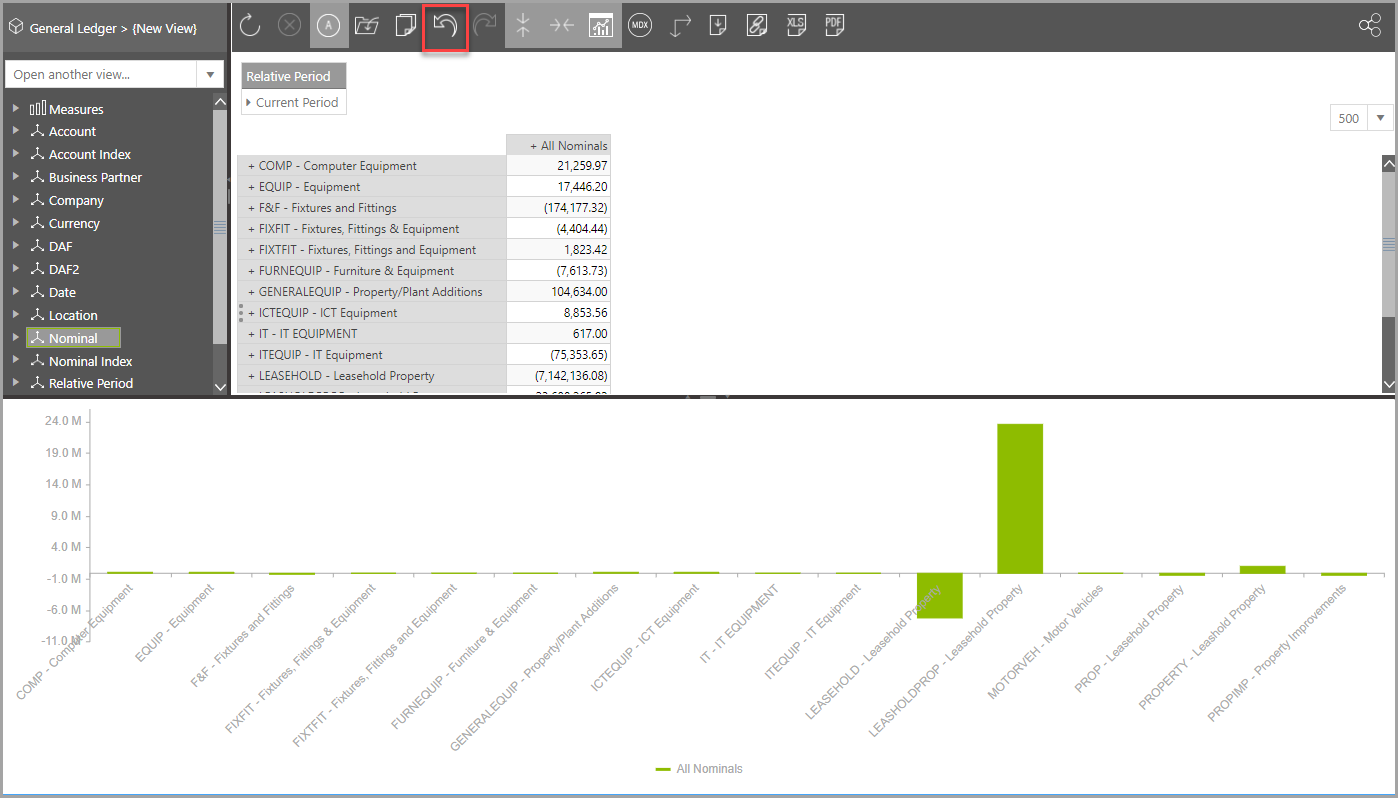
In data view charts, you can click on a data point in the chart which drills down to the children of the selected item.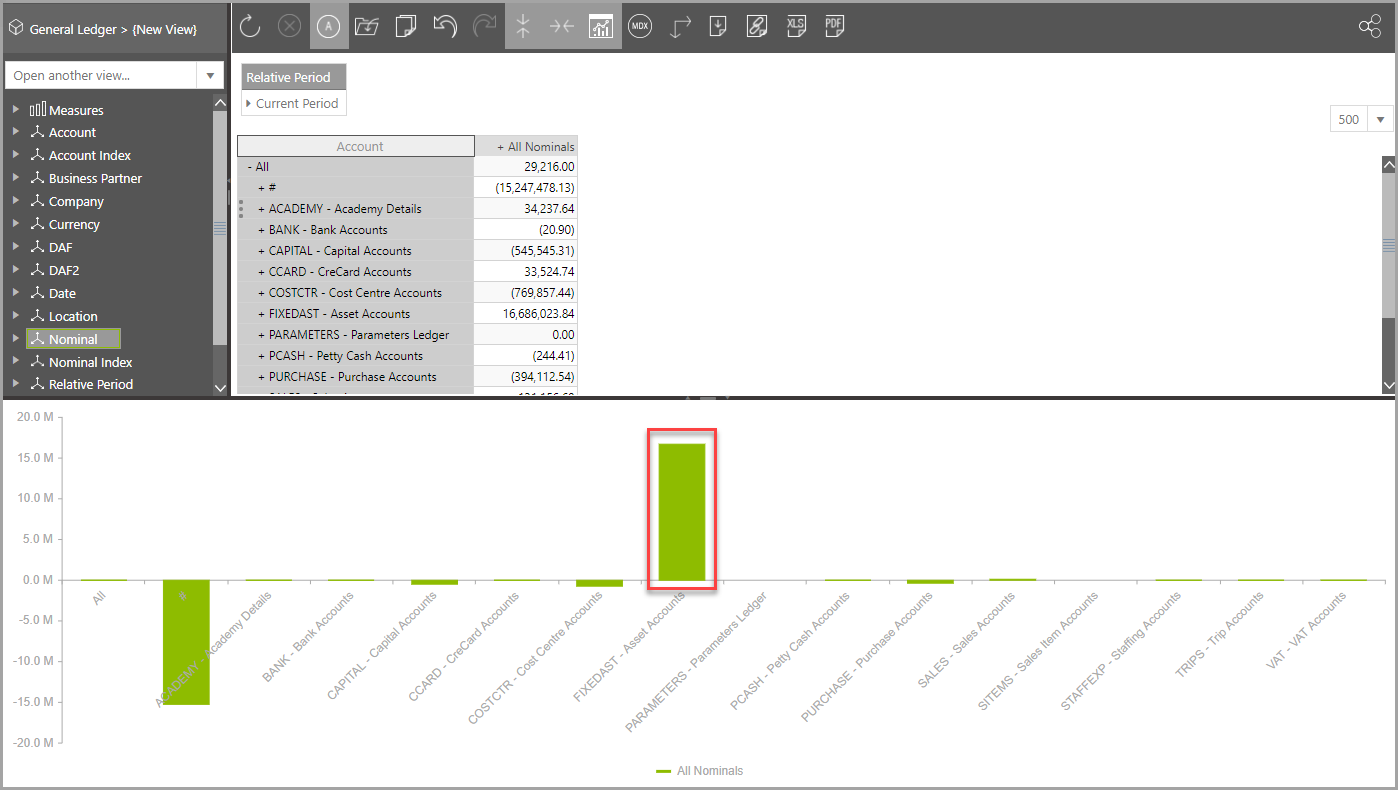
To navigate back up, click the Undo icon on the data view toolbar.
Drilling Down in Reports
Depending on the depth of analysis offered by a report you may be able to drill down and through to view subsets of data or transactions that have contributed to particular data points. Drilling down allows you to navigate further down an existing hierarchy of data that is on the report. For example, if you were to view the total sales for the UK, drilling down would allow you to interrogate the total sales for each county.
Drilling through on the other hand is about drilling from a number (data point) through to the transactions that made up the data point or to related information about it.
You can drill down for further data by clicking any blue label.
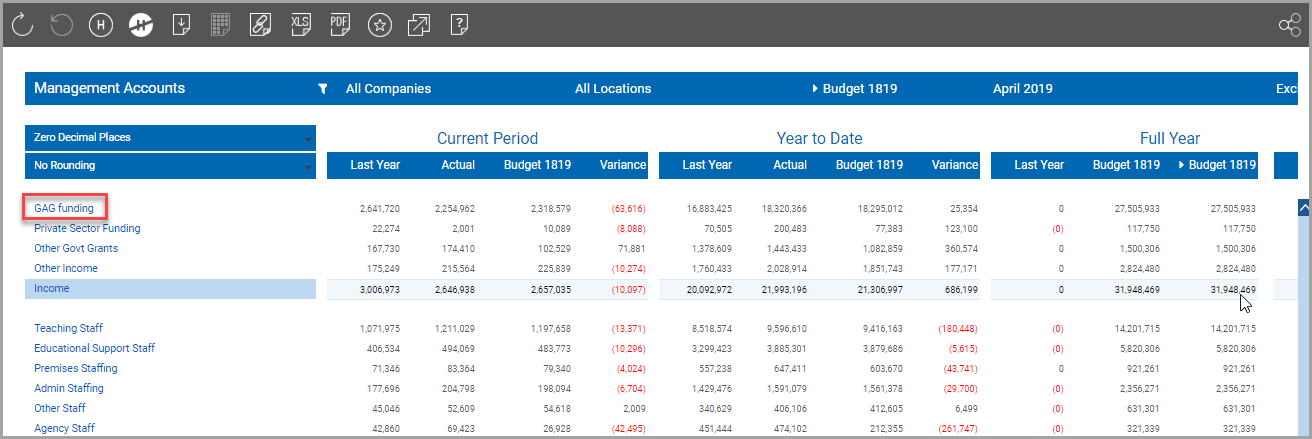
The report then expands to show more detail.
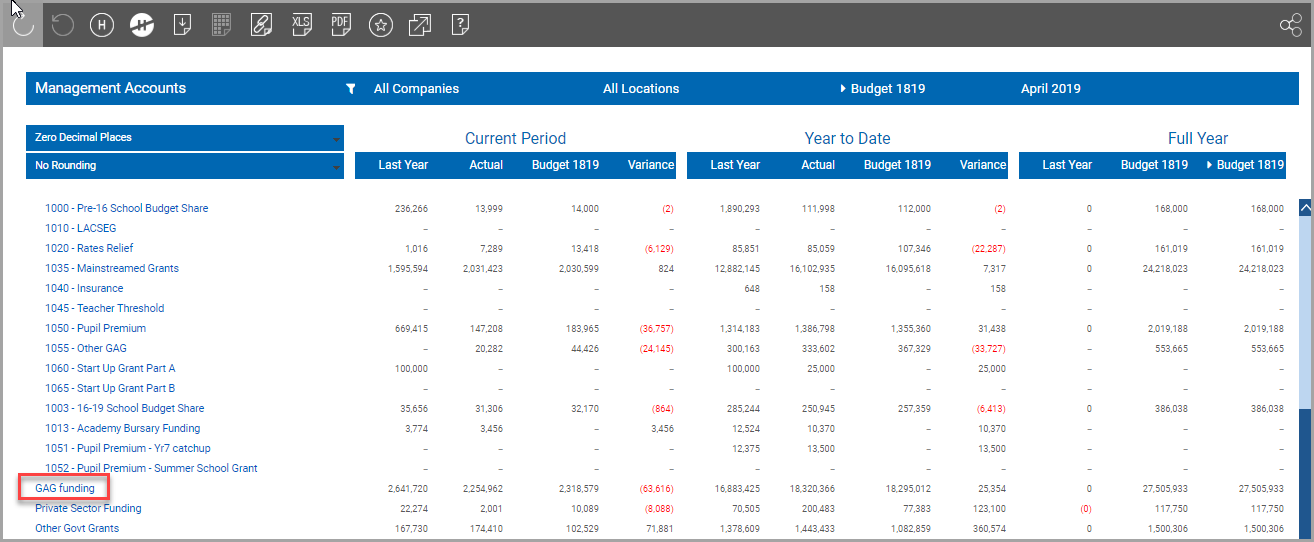
Clicking on the original link again will contract the list back to its original state.
Drilling Through to Transactional Data in Reports
In order to gain greater understanding of the data given, you can also drill through to the transactions for a particular data point (selected cell on a report). Once you have selected a cell, click the Drill Through icon on the toolbar.
![]()
A list of transactions is then displayed on a separate Drill to Transactions tab. Depending on the way your report has been configured, the separate tab you are taken to may also contain additional tabs containing information related to the data point.
![]()
The list can be exported if required by clicking the Export button on the tab.