Spreading Data for Budgeting and Forecasting
When viewing reports or data views, it is possible to amend some of the values for budgeting and forecasting. You may for example, want to assess a budget where figures are 10% higher. This is achieved using spreading.
A spreading action is started by selecting a range of cells using click and drag to draw a box around the cells that you want to act on.
Spreading actions on a set of selected cells will always be applied left to right then top to bottom.
Once cells have been selected, the spreading menu will appear:
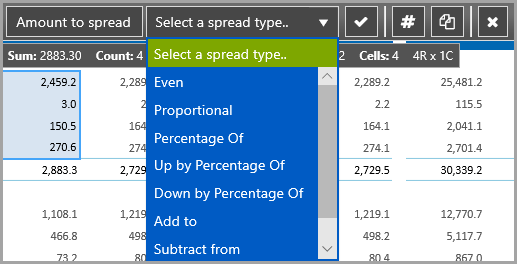
Select the required spreading option then click the Tick icon.
Selecting the Type of Spreading You Want to Use
A variety of spreading types are available:
| Even | Enter a number which is spread evenly across the range. In the following example, 2883.30 has been spread evenly across the selected cells. The original figures are overwritten and the new figures are highlighted in green.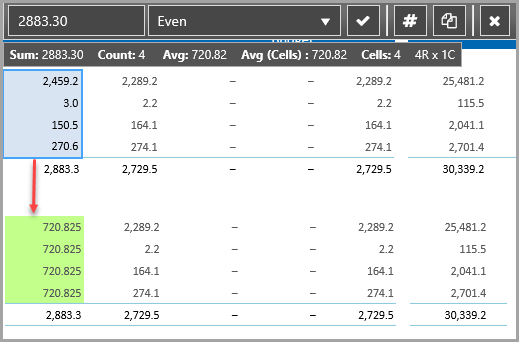 |
| Proportional | Add a figure to the numbers spread across the selected range proportionally. In the following example, £4000 has been spread using the same proportions as the original £2883.30. The original figures are overwritten and the new figures are highlighted in green.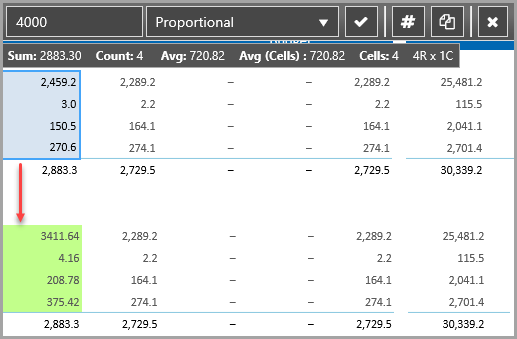 |
| Percentage of | Insert the specified percentage of each value in the cell across the selected range. In the following example, each cell in the range is 10% of the original value. The original figures are overwritten and the new figures are highlighted in green.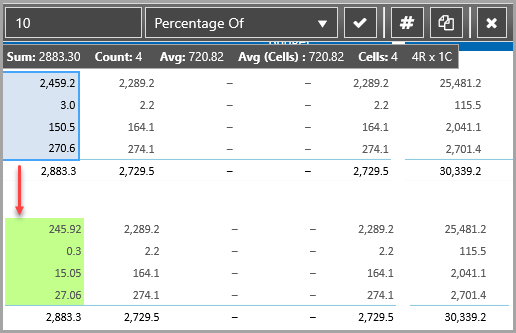 |
| Up by Percentage of | Increase the figures across the selected range by a certain percentage. In the following example, the figures have been increased by 5%. The original figures are overwritten and the new figures are highlighted in green.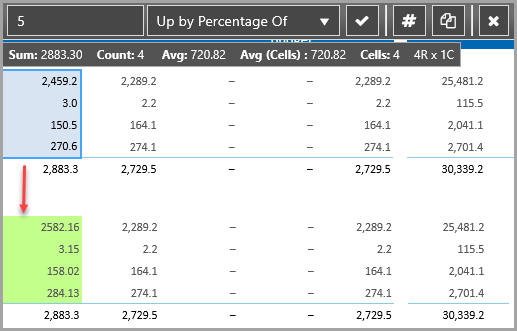 |
| Down by Percentage of | Decrease the figures across the selected range by a certain percentage. In the following example, the figures have been decreased by 5%. The original figures are overwritten and the new figures are highlighted in green.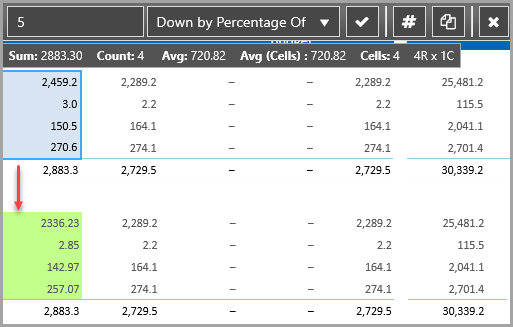 |
| Add to | Add a figure to the numbers spread across the selected range. In the following example, 500 has been added to each cell. The original figures are overwritten and the new figures are highlighted in green.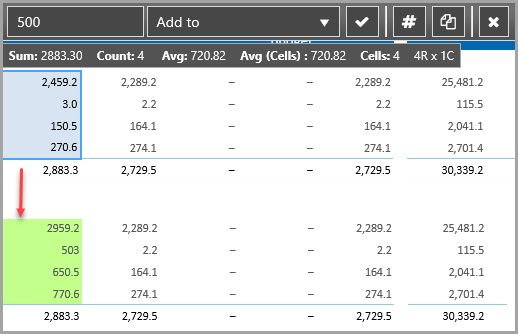 |
| Subtract from | Subtract a figure from the numbers across the selected range. In the following example, 500 has been subtracted from each cell. The original figures are overwritten and the new figures are highlighted in green.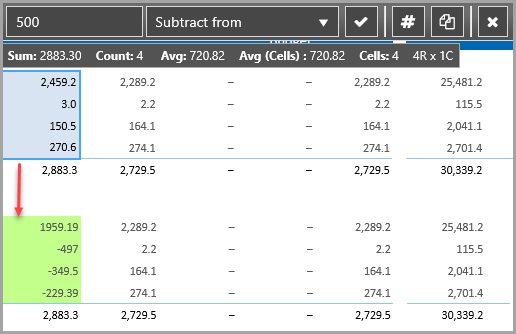 |
| Make Value | Inserts the value entered into each cell across the selected range. In the following example, 100 is entered as the value in each cell. The original figures are overwritten and the new figures are highlighted in green.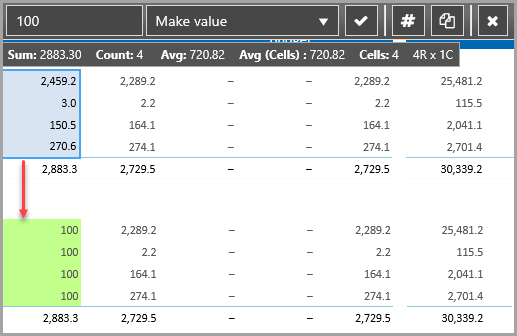 |
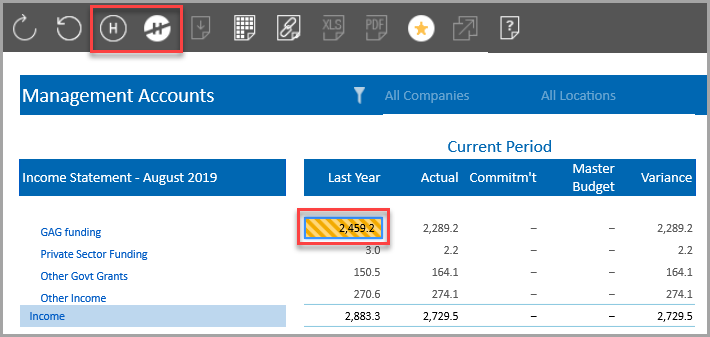
Holding Cells Whilst Spreading
There may be occasions when you want to carry out a spread across a range of cells, but exclude one or two cells from the spread. For example, you may want to apply a salary increase with the exception of a certain role. This is achieved by holding the cells you do not want to include in the spread.
Cells are held by highlighting the applicable cell, then clicking the Hold the Selected Cell icon on the toolbar, or pressing H on your keyboard. This needs to be done before the spread is applied. The applicable cell is then highlighted in orange. If you need to hold multiple cells, hold down the Ctrl key then click on each required cell.