Monthly Profit and Loss
The project monthly profit and loss report is a financial statement that summarizes the revenues, costs and expenses incurred over a calendar month, filtered by project.
Running the report
From Reports:
-
Go to Home > Reports > Financial, then select Monthly Profit & Loss.
-
Select the Time period, Start date, End date, and Project.
The chart will update according to your selections.
From Projects:
-
Go to Banking > Projects.
-
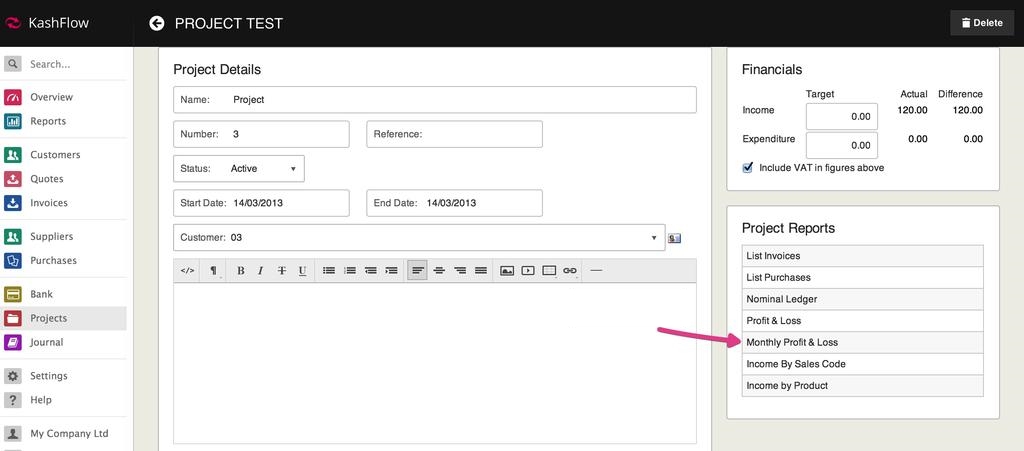
Select the relevant project, then in Project Reports select Monthly Profit & Loss.
-
Any comments added will be available while you are preparing the report and will appear on the downloaded or printed charts, however, they will not be stored in IRIS KashFlow to refer to at a later stage.
-
You can download, Print, or Email the chart.
Report settings
In Customise you can choose whether to show:
-
Turnover
-
Net profit
-
Gross profit
Understanding Monthly Profit and Loss
This report will present your profit and loss report as a line graph detailing your turnover, net profit and gross profit over your selected period.
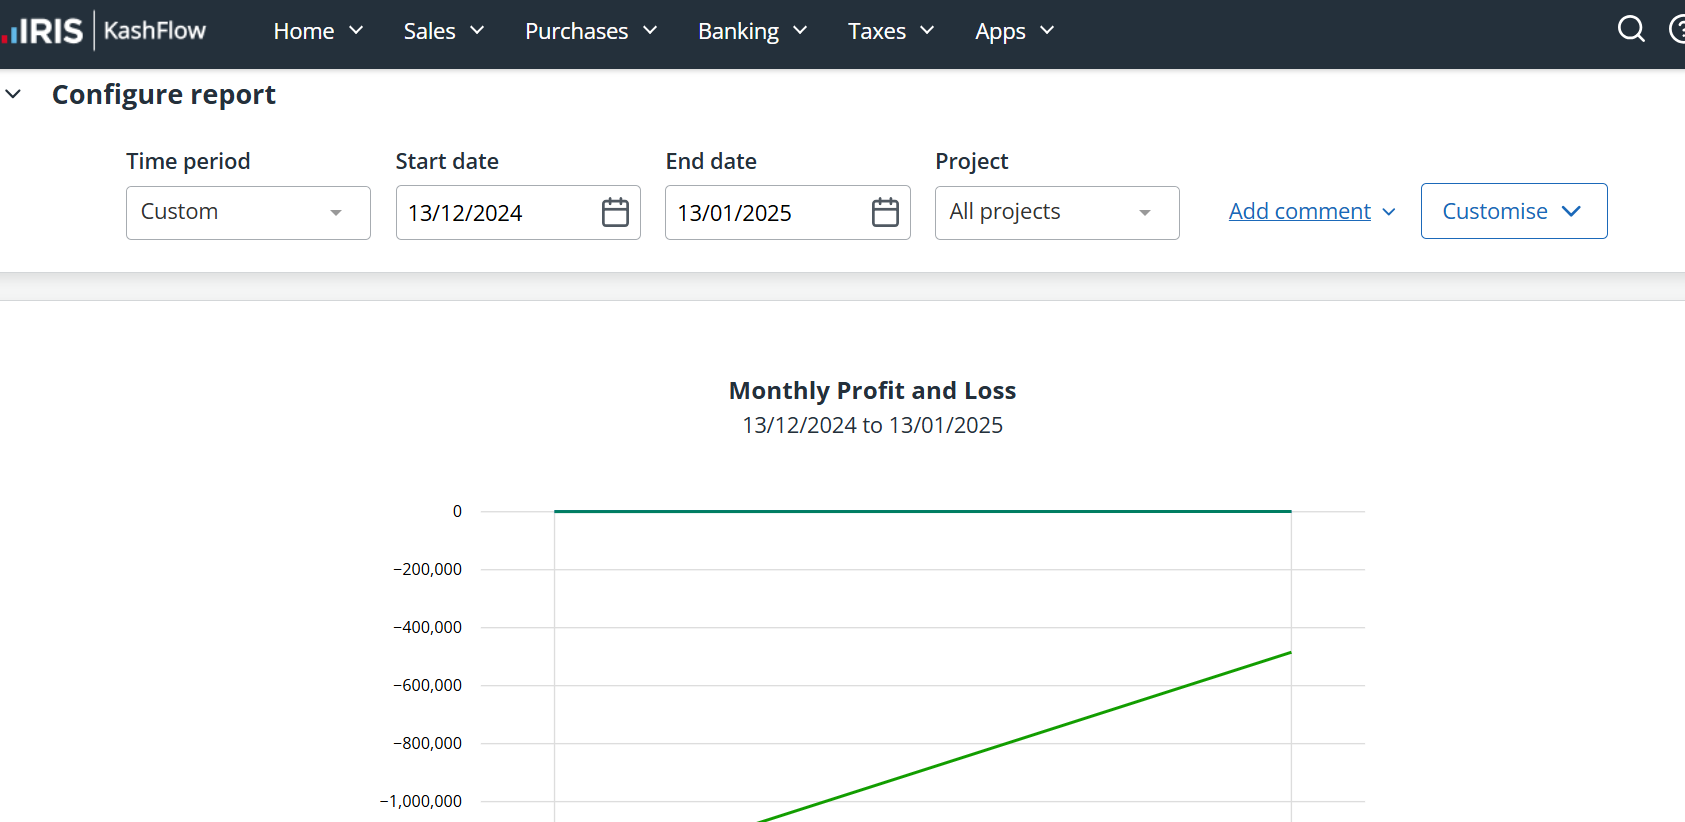
As this is the monthly profit and loss the dates entered here will be inclusive of the selected months. For example, entering in 25th Feb to 5th Mar will detail the profit and loss for all of February and all of March.