Secondary graph
The secondary graph widget can be set to display 12 month sales growth, 6 month profit and loss or 6 month income by source.
From the menu select to display:
-
12 month sales growth: This displays the amount of sales growth over a 12 month period. Sales growth is tracked based on invoices generated (accrual in accountancy speak) meaning it doesn’t track if the invoice is paid or not. Selecting this graph will take you to the sales growth report.
-
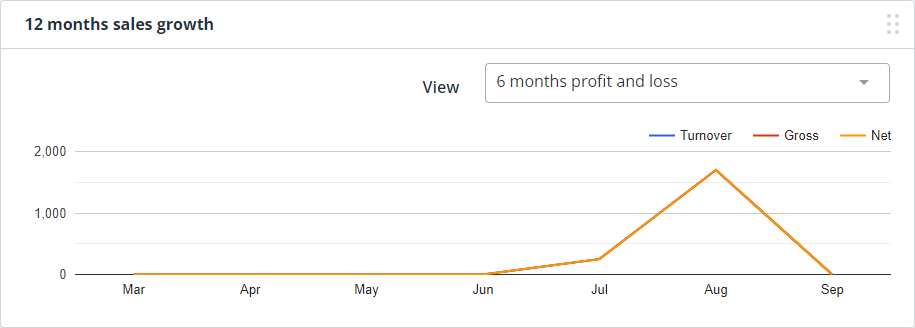
6 month profit and loss: This shows your P&L balance over a 6 month period and renders your gross profit, turnover and net amount. Selecting this will take you to the monthly Profit & Loss report.
-
6 month income by source: This shows you your income by source report over a 6 month period (regardless if the invoices are paid or not) and displays a maximum of 3 sources defined by you (selectable on Settings > Display Settings). Selecting this will take you to the Income By Source report.