 |
 |
Expressions are used to provide variable data in reports. These can be used at Client level or they can be set as a default to be applied to all clients using the same Chart of Accounts.
We advise that you watch the following video before viewing this topic.
Click the links below to jump to a particular section:
Using Functions in Expressions
RELATED PARTY 1 - Note example
Setting Expressions at Chart Level
Creating Expressions in tables
Example of Expressions in a table
Examples from current IRIS clients
Creating an Expression:
Open Accounts Production.
Select Setup | Account Charts
Select the Chart and click Amend.
Fom the list, select Expression Designer. The Expression Designer screen displays.
Click New.
Enter the Expression Name and Expression Description.
Select a Function from the list on the left-hand side and drag and drop into the Expression Text box.
AccountDesciption - returns the Account description of the account code you have chosen.
CurrentYearTotal - returns the Total for the current year of single or multiple accounts
LastYearTotal - returns the Total for the previous year of single or multiple accounts
GroupDescription - returns the name of the group you of account codes
Involvement - returns the name
of the involvements with this company, for example the director’s name
for the 1st involvement.
We will use the CurrentYearTotal, so we drag this into the Expression Text box. We are then presented with the Function Builder:
The Please Choose an Account screen displays.
Select the Account Code from the list. If you know the account codes from memory you may add the number into the Expression Text. For example, Functions.CurrentYearTotal("471", "472")
Repeat steps 1, 2 and 3 to add multiple accounts
Click OK and Save.
Expression: Functions.InvertFigure(Functions.CurrentYearTotal("2"))
IRIS Issued and User Expressions can be inverted using the InvertFigure function.
To do this:
Create a new Expression and drag the InvertFigure function into the Expression Text box.
Select the User Create Expressions or Issued Expression tab.
Select the Expression that needs to be inverted and drag this function in between the brackets in the Functions.InvertFigure ( ) expression.
Example: Functions.InvertFigure( {Group 1 balance current year}) returns the Total Group 1 Turnover codes 1 to 10/1-50 without brackets.
Open Data Screens.
Select a text note to add the expression to, This must be a text note.
On the menu bar, click Expression.
This shows you all the current expressions IRIS has provided for you by default and also the expressions you have created (under User Expressions).
Select the Expression you wish to use.
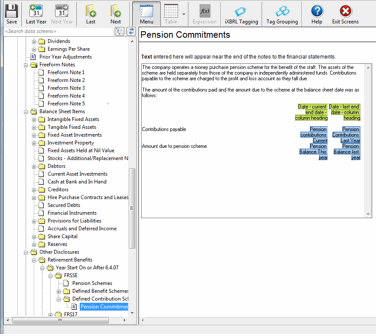
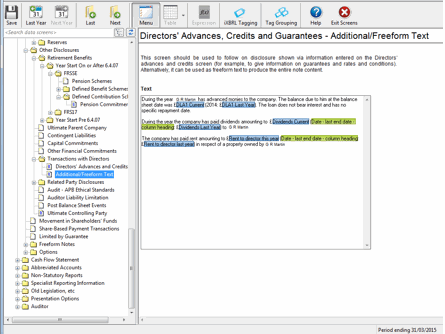
Click Select (you will then see the expression highlighted in Green or Blue depending on which expression type you have chosen).
Green highlighted text means that it is a standard IRIS Expression. Blue means that the Expression has been created by a user.
Example note shown in the demo video.
Expressions to make (see “To Create an Expression” at the beginning of this document for guidance):
DLA CY Cap Intro 1 - Functions.CurrentYearTotal("728/2*1")
DLA CY Repayment 1 - Functions.CurrentYearTotal("728/21*1")
DLA PY 1 - Functions.LastYearTotal("728*1")
Issued Expressions:
Currency symbol – Inserts the currency symbol set for this client
Date - last end date - textual - dd Month yyyy – shows the date, for example - “31 March 2015”
Text to add to the note:
"During the year under review, the following transactions took
place with Mrs C D Smith the Director:
Loans to the company Currency symbol DLA CY Cap Intro 1
Repayments to the Director Currency symbol DLA CY Repayment 1
As at Date – last end date
– textual – dd Month yyyy, Currency
symbol DLA PY 1
was due to the Director.”
The populated expressions would look like this on the face of the accounts
without the highlights:
“During the year under review, the following transactions took place with
Mrs C D Smith, the Director:
Loans to the company £15,000
Repayments to the Director £1,800
As at 31 December 2013, £18,500 was due to the Director.”
This will allow you to add default Expressions to all of the notes for a particular Chart of Accounts.
Data Screen items can be set at chart level Setup | Data Screen Defaults. This speeds up the creation of new clients as items such as the choice of accountants certificate will already be set up.
Any default setting will be used whenever a new client is created or will be included for existing clients when the Bring Forward Client Data is run for a new year.
Items area not automatically applied to a year that has been completed or is in progress. To apply newly added default setting to a year that is in progress run Apply Default Values.
From the Accounts Production main screen.
Select Setup | Data Screen Defaults. The 'Chose Where to Store Defaults' screen displays.
Select Chart.
Click the magnifying glass and select the report. The Hierarchical Default Data: Chart screen displays.
Follow instructions as for Client level in section, Adding an Expression to Notes.
To add tables to Notes / Text boxes in the Data Screens:
Open Data Screens.
From the tool bar, click Table.
Enter the number of rows and columns and click OK.
Once a table has been created, text and Expressions
can be entered using the fx Expressions
in the single click tool bar.
To adjust the table you have created, right-click to:
Select table columns, rows or cells
Insert table rows or cells
Delete table columns, rows or cells
Split table or cells
Merge Cells
Cell Properties
Table Cell Properties allows you to adjust the:
Character width
Character gap
Cell content – to state the data you have in the table, this is important when using Auto Total
Shading
Auto Total – allowing you to total the numeric values in the rows above
A range of display settings - Adjusting the Vertical and Horizontal alignment, Printer wrapping options and also the option to add Rule-off lines to a table cell.
The statement and table below can be created in the Data Screen using a combination of inserting a table, text and Expressions.
For example:
“The total turnover for IRIS Books Limited for the year is 316,494".
The details are shown below:
| Sales | 315,260 |
| Contracts | 1,234 |
| 316,494 |
Table 1
This example can be edited to include expressions which is shown below in Table 2.
The turnover for (Business name) for year/period for current year is Group 1 balance current year inverted.
The details are shown below:
| Sales Account Description | Sales Account Total Account |
| Sales Contracts Account Description | Sales Contracts Total Account |
| #TOTAL# |
Table 2
Business name – Standard expression found in the General folder
year/period for current year – Standard expression that displays the word year or period for the current year’s accounts
Group 1 balance current year inverted - Functions.InvertFigure({Group 1 balance current year}) – The standard 'Group 1 balance current year' expression has been inverted to show the value without brackets
Sales Account Description - Functions.AccountDescription("1")
Sales Account Total Account - Functions.InvertFigure(Functions.CurrentYearTotal("1"))
Sales Contracts Account Description - Functions.AccountDescription("2")
Sales Contracts Total Account - Functions.InvertFigure(Functions.CurrentYearTotal("2"))
#TOTAL# - The Auto Total is calculated within the Table created in the Data Screen by following these steps:
Right-clicking on the cell you wish to create an automated total.
Select the Cell Properties option.
Click Auto Total.
You will need to make sure that the
Cell Content drop-down option is set to the same type for all of the
numbers you wish to total.
Here are a couple of expressions to provide you with ideas of which notes you can produce and the benefit of using IRIS Expressions.

